Home-field advantage, rest, and travel: how much each is worth on this site's cards
Home field is not a flat number
A common shorthand says the home team starts three points ahead in football. That shorthand does not hold here. Home field appears as its own line in the breakdown of a model margin, beside offense, defense, quarterbacks, and other factors, and its size changes from game to game. In most NFL games in the current feed, it is a small fraction of a point.
Carolina at Green Bay is the small case: home field is a small fraction of a point, while the model margin is about 4.5 points toward Green Bay and the line is Green Bay -3.5. The other parts carry far more of the margin.
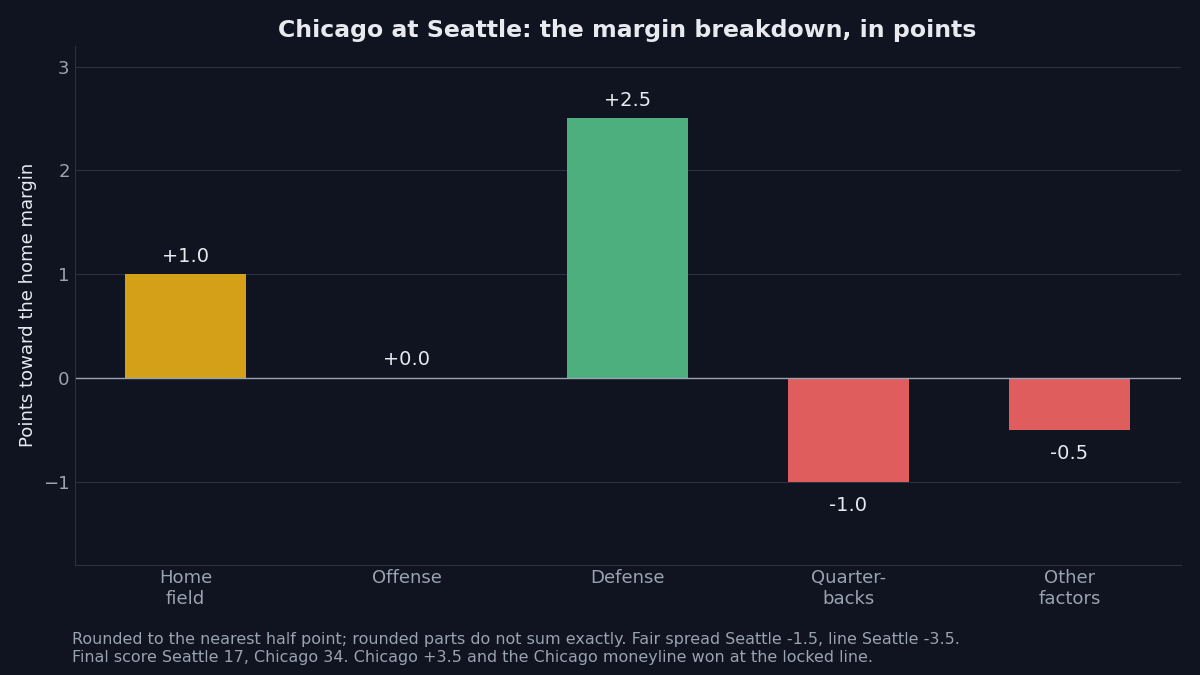
Chicago at Seattle is the larger case. Home field is about one point toward Seattle. Offense is about 0 points, defense is about 2.5 points toward Seattle, quarterbacks are about 1 point the other way, and other factors are about half a point the other way. The fair spread is Seattle -1.5, while the market line is Seattle -3.5. Seattle has a home edge in the model number. It is one part among five, and it is smaller than the defense part.
In college football, the driver list gives home field well under half a point for a home game, beside offense and defense drivers worth several points. In hockey, the home part in four games on Nov 3 is well under half a goal in each game: about one extra goal across seven home games. In each sport, the home part is small beside the parts that describe how the two teams play.
Rest is a calendar gap, and in hockey a second night
Rest is not one thing. In football it is a gap in days between games. In hockey it is often a second game on a second night. The feeds show both, in different places.
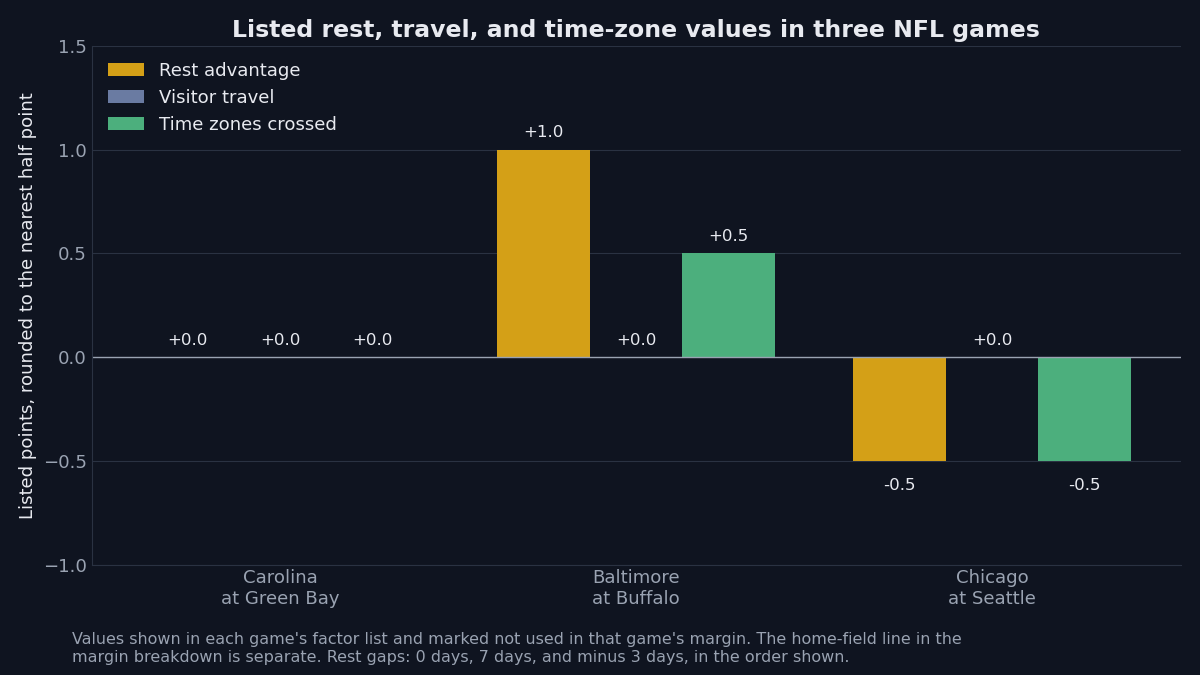
The NFL factor list carries a rest advantage entry measured in days. For Baltimore at Buffalo, the list shows a seven-day gap, with a listed value of about one point, marked not used in that game's margin. For Chicago at Seattle, it shows a three-day shortfall, with a listed value of about half a point the other way, also marked not used. For Carolina at Green Bay, the gap is zero days, and the listed value is about 0 points. The list also carries a coming-off-a-bye entry, well under half a point, marked not used. A rest gap can be listed and still not used in a given margin.
Baltimore at Buffalo shows why a rest gap alone settles nothing: the model number had Baltimore ahead by about 2 points, the line was Buffalo -3.5, and Buffalo won 36-10. A single game never proves a rest rule in either direction.
Hockey handles rest more directly, with a back-to-back flag and a rest part in the expected goals. Detroit at Tampa Bay on Nov 3 is the example: Detroit played on the second night, the rest part is a small fraction of a goal in each direction, and the second-night team gets an attack multiplier just under one and a defense multiplier just over one. Tampa Bay won 4-2, so Detroit +1.5 on the puck line did not cover. The rest part is built into the expected goals, in the same units as the home part, and it is small beside the team parts.
Travel and the body clock are context, measured in bands
Travel is measured in the feeds, and it is kept separate from the home-field line. The NFL factor list records visitor travel in units of 1,000 kilometres and time zones crossed as a count. Chicago at Seattle is the long trip in the sampled games: nearly 2,800 kilometres and 2 time zones, with listed values of about 0 points for travel and about half a point the other way for time zones, both marked not used. Carolina at Green Bay is shorter: about 1,200 kilometres and 1 time zone, with listed values near 0 points. A visitor-at-altitude entry and an early body-clock entry were also small and marked not used in the sampled games. A long trip is real, and the feed measures it, without automatically turning distance into points.
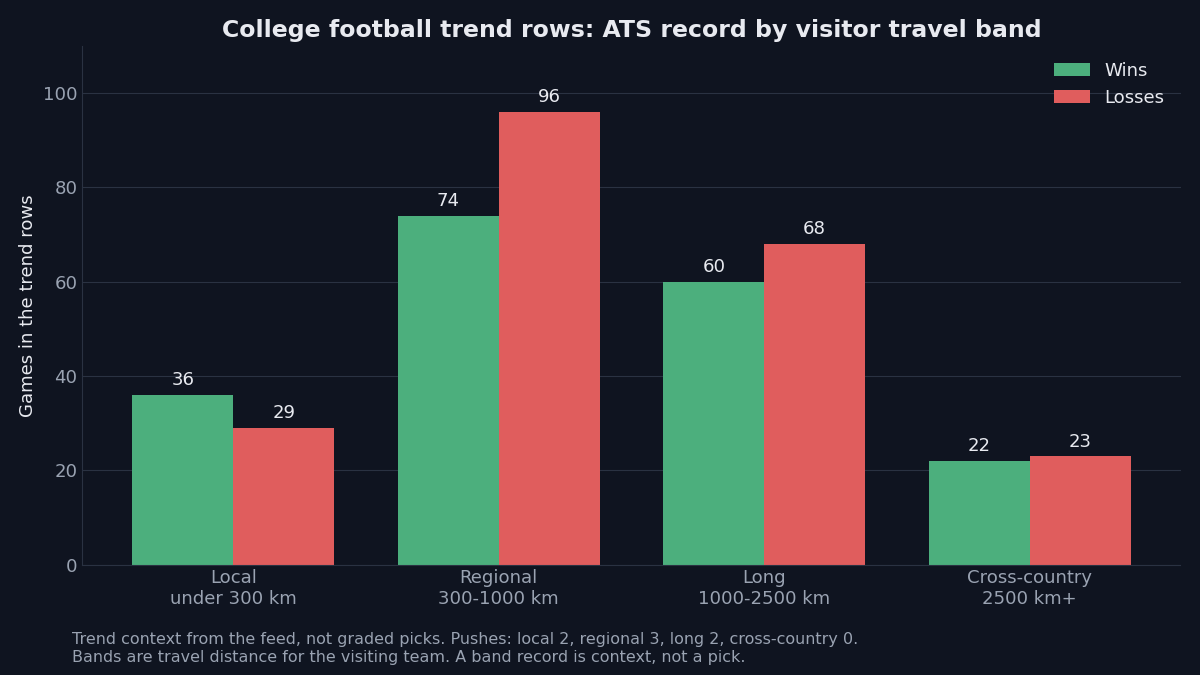
College football keeps travel in bands, and the trend rows in the feed carry a record for each band. The local band is 36 wins and 29 losses, with 2 pushes. The regional band is 74 wins and 96 losses, with 3 pushes. The long band is 60 wins and 68 losses, with 2 pushes. The cross-country band is 22 wins and 23 losses, with no pushes. Those are trend rows, not graded picks. They are context for reading a card, not a pick in themselves.
How to read a home edge on a card
Start with the breakdown, not the venue: compare the home-field line with the offense, defense, and quarterback lines in football, and the home and rest parts with the team parts in hockey. Then check rest in the form the sport uses, and travel and time zones as context. None of these entries decides a game on its own.
Finally, remember that the line already reflects home field. The market line for Seattle was -3.5, and the model number was -1.5, a gap of 2 points. A home edge does not add to the gap. Chicago at Seattle shows the point: the home team was the favourite, the model lean pointed the other way, and Chicago won 34-17.
Home field, rest, and travel are small parts of a larger number. Read them as parts, check whether each one was used, and keep the size of each part in view.
21+. If gambling stops being fun, call or text 1-800-GAMBLER.