How to read a game page: every number on a matchup, explained
Every game page on this site has the same six parts: the model's numbers next to the market's lines, the three chances, the label, the breakdown, and the deeper tables. They work the same for football and hockey. Here is what each part says, using three real games: tonight's Chargers at Ravens, last Thursday's Jaguars at Ravens, and last night's Oilers at Flyers.
The top of the page: two numbers, two lines
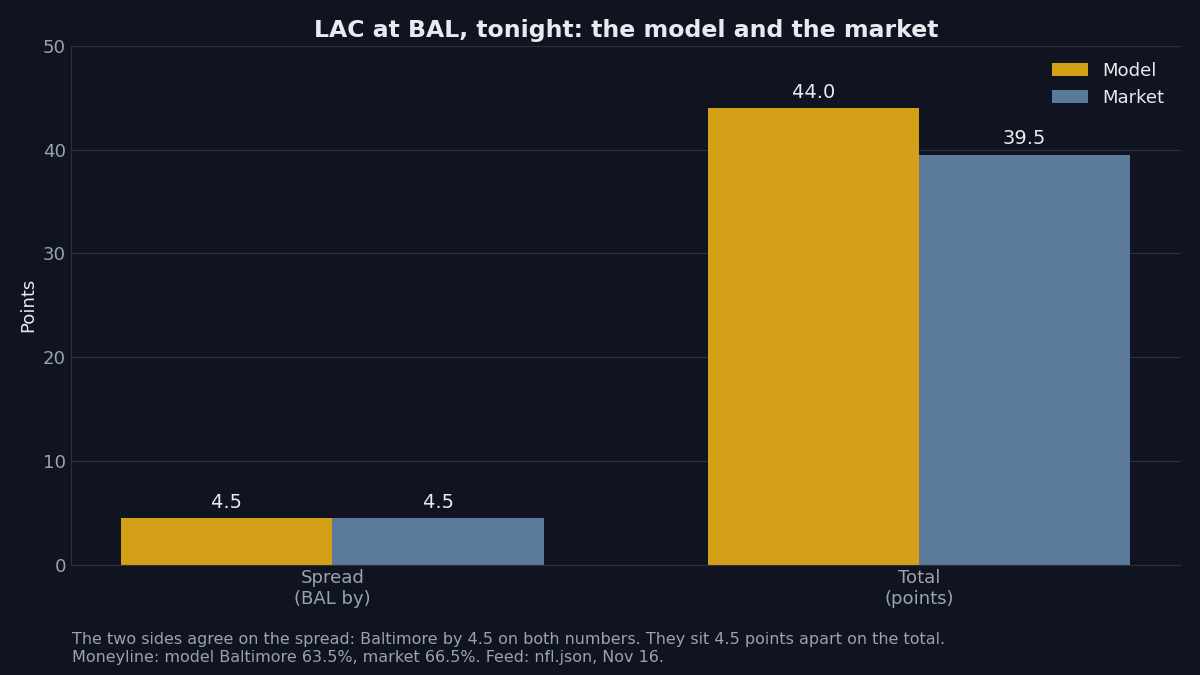
The top of the page holds two numbers from the model and two lines from the market. Tonight the model has Baltimore by 4.5 and a total of 44, built from 24.5 for Baltimore and 19.5 for the Chargers. The market has Baltimore by 4.5 and a total of 39.5: the spreads agree exactly, the totals sit 4.5 apart.
Last Thursday they disagreed on both: the model had Jacksonville by 7 and a total of 46, from 19.5 for Baltimore and 26.5 for Jacksonville, while the market had Jacksonville by 9.5 and a total of 39.5 — gaps of 2.5 on the spread and 6.5 on the total.
The fair line sits next to them: the model margin and total to the nearest half point, and the moneyline the model chance implies — tonight Baltimore by 4.5, a total of 44, and -172 against +172, while the market moneyline is -225 and +185.
The three chances
Under the numbers, the page gives three chances: the home side covering, the game going over, and each side winning outright. Each is shown twice, the model's number and the market's, and the difference is the edge.
Tonight the total is the widest gap: the model gives the Over 39.5 a 51% chance against the market's 49%, a moderate label. The Chargers moneyline is slight, 37% against 33.5%. The spread has no label: the model gives Baltimore a 47.5% chance to cover 4.5 against the market's 50.5%.
Last Thursday all three markets carried a label. Baltimore +9.5 was slight at 54.5% against 49%. The Over 39.5 was strong at 51% against 50%. The Baltimore moneyline was slight at 23.5% against 20%. Jacksonville won 33-10, with 43 points on the board. The spread finished at -1.0u, the total at +1.0u, and the moneyline at -1.0u.
When the page shows numbers but no pick
Some pages show the chances and no label at all. Last night the model gave the Flyers a 50% chance against the market's 43%, and the Under 6.5 a 63.5% chance against 55%. Neither line carried a strength label, so no pick was published. Edmonton won 5-2, with 7 goals, and nothing was graded.
Dallas and Florida the same night showed three leans and no labels either, and Dallas won 2-1 in overtime. A page with numbers and no label is the normal case: the model speaks on every game, and a label appears only when the gap clears the floor.
The breakdown: where the number comes from
Below the chances, the page breaks the model number into parts. Tonight's spread reads: home field 0, offense +2.5, defense +0.5, quarterbacks 0, other factors +1.5 — adding to Baltimore by 4.5. Last Thursday's total reads: league scoring 46, both offenses +3, both defenses -3, quarterbacks and other factors 0 — adding to 46.
The quarterback part moves most often: last Thursday it was -3.5 for Baltimore, with the backup Fagnano starting in place of Jackson. Tonight it is 0, with Herbert at his usual mark and Baltimore's adjustment rounding to 0.
Hockey pages break the number down the same way, in expected goals: each side starts near a league base of 2.5 goals and moves a little for offence, defence, home ice, rest, the lineup, finishing, and the opposing goalie. The goalie table lists each starter with a start chance: Vladar 92% for the Flyers, Jarry 92% for Edmonton, Levi 5%. The page also lists the weather, 42.5 degrees with a 5.5 mph wind, and the injury report.
The deeper tables
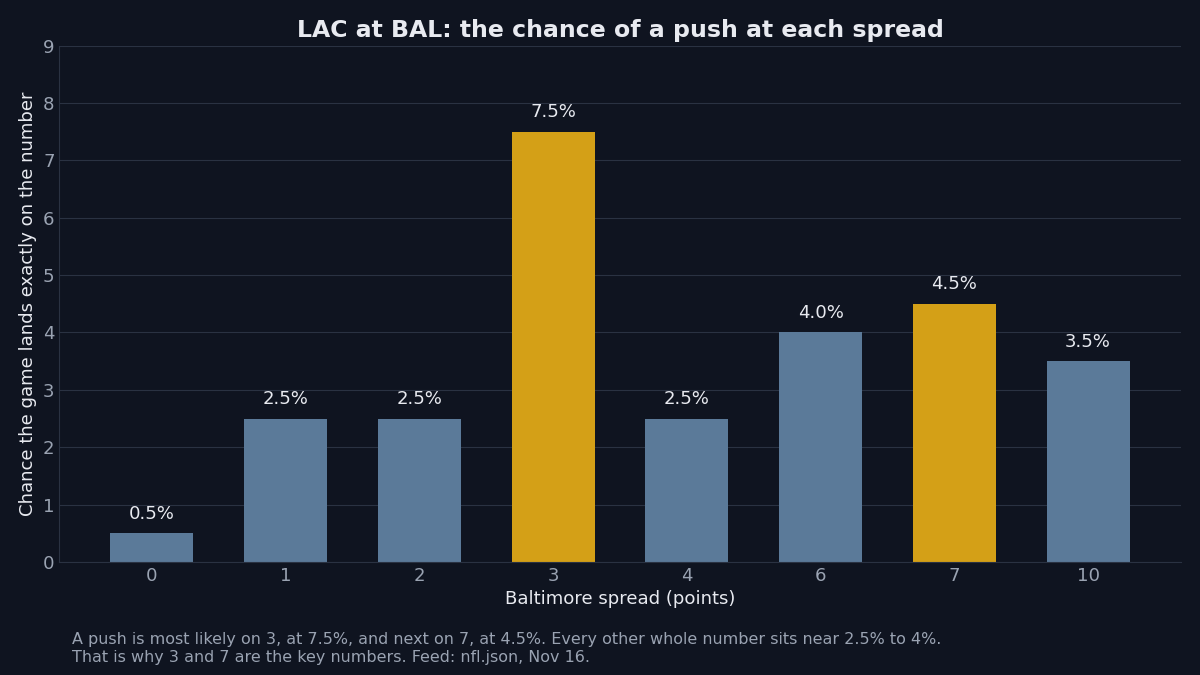
First, the alternate lines. For tonight's spread, the page lists the chance Baltimore wins and the chance of a push at every half point from 0 to 10. A push is most likely on 3, at 7.5%, and next on 7, at 4.5%; every other line sits at 4% or less. That is the shape behind the key numbers.
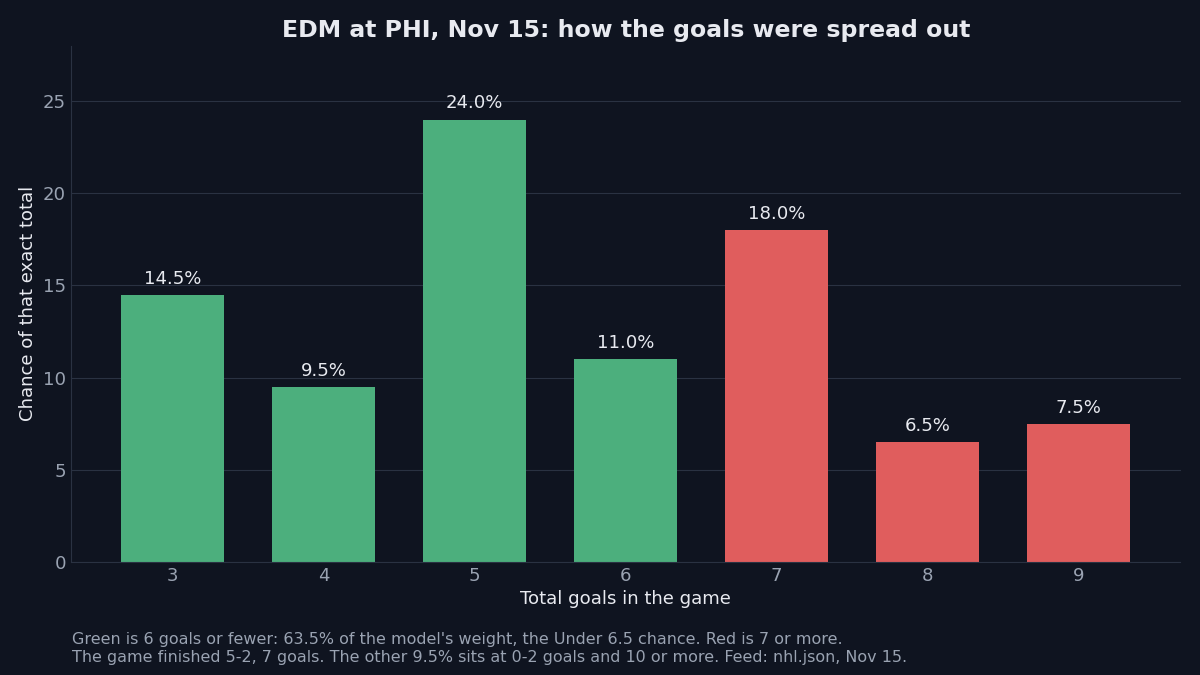
Second, the hockey total chart. The page lists the chance of every exact goal total, and the Under 6.5 chance is the sum of all the totals up to 6. In Philadelphia the 5-goal outcome was the single most likely at 24%, the 7-goal outcome sat at 18%, and the Under 6.5 chance added to 63.5%.
Third, the history. The page keeps every earlier price. Baltimore opened at -1.5 and now sits at -4.5, with the spread holding at 4.5 since November 10 and the moneyline moving from -235 to -225. In Philadelphia, the Flyers' win chance moved from 49% to 50% across three days while the projected Edmonton goalie changed from Levi to Jarry.
The trends box is context, not a pick. For tonight's total it lists the trend read as Under 39.5, against the model's Over 39.5, with the bands behind each side; one band on the model's side, a side in the playoff hunt, reads 15-7. The label does not move because of the trends box.
Read a page in order: lines, chances, label, breakdown, tables. The lines say what the market thinks. The chances say where the model disagrees. The label says whether the gap was wide enough to publish. The breakdown says why. The tables say how the number has moved. Everything is graded at the line it locked at, so what you read before kickoff is what the record keeps.
21+. If gambling stops being fun, call or text 1-800-GAMBLER.