How to read a playoff percentage: what 99%, 48%, and 4% actually mean
On the site's NHL power pages, every team carries a set of percentages: a playoff share, a division share, and a share for each round of the playoffs, all the way to the Cup. Carolina sits at 100% for the playoffs and 24.5% for the Cup. Toronto sits at 4% for the playoffs and 0% for the Cup. The numbers look simple. Reading them well means knowing what they count, and what they leave out.
A percentage is a count of simulated seasons
A simulation replays the rest of the season many times from the ratings and rosters of today, then counts how often each outcome comes up. Carolina's 100% playoff share means the simulation could barely find a season where Carolina missed. Colorado's 99% means Colorado missed in 1 of every 100. The shares describe the rating as it stands today, with rosters as of November 15, and they move after every night of games.
That is also why a share is not a prediction about one team in isolation. A 4% share for Toronto does not say Toronto will miss the playoffs. It says that, from the rating Toronto holds today, the path to a playoff spot comes up in 4 of every 100 replays. The rating is the opinion; the share is the arithmetic.
The ladder: each round narrows the share
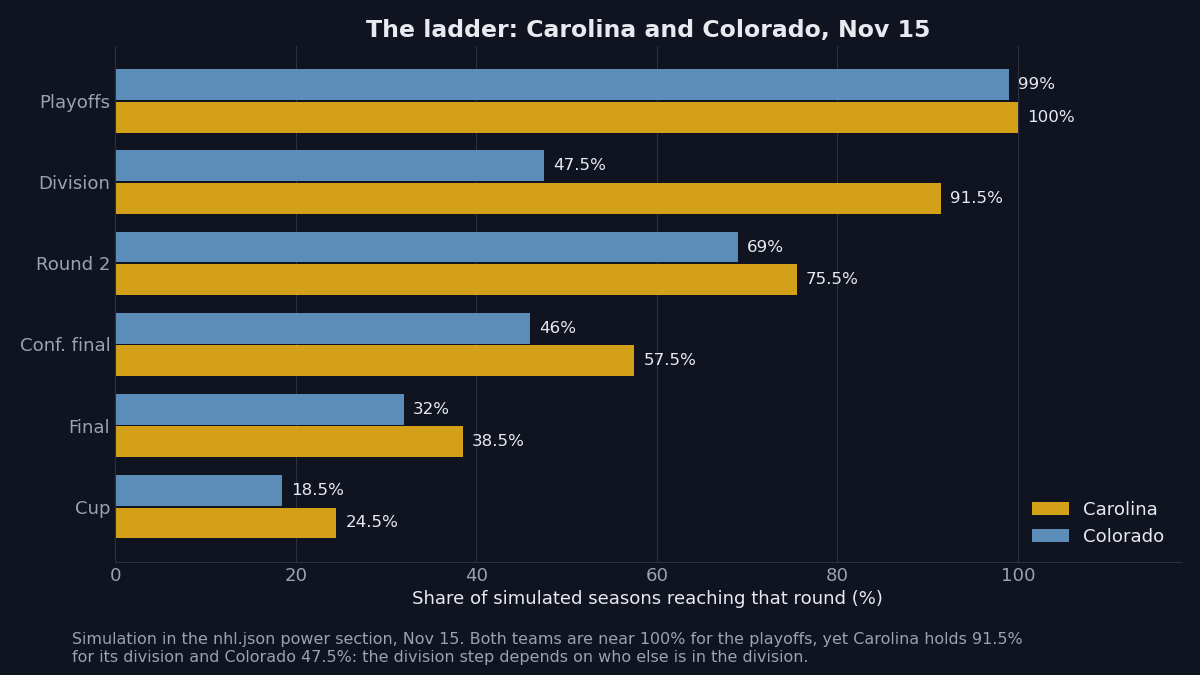
Every team has six numbers, and they form a ladder: playoffs, division, round 2, conference final, final, Cup. Each step is a smaller group than the one before it, because each step needs everything below it plus one more round won. Carolina's ladder reads 100, 91.5, 75.5, 57.5, 38.5, 24.5. Colorado's reads 99, 47.5, 69, 46, 32, 18.5.
Two things stand out. First, the two teams agree at the top and split in the middle: both are near 100% for the playoffs, yet Carolina holds 91.5% for its division and Colorado 47.5% for its own. A division share depends on who else is in the division. Second, the Cup shares are the thinnest numbers on the page. Carolina at 24.5% and Colorado at 18.5% hold 43 of every 100 simulated Cups between them. The other 30 teams share the rest.
Points and the rating disagree on purpose
Points count what has already happened. A rating weighs how a team has played, who it has played, and who is in the lineup now, then projects that forward. Early in a season the two can point in different directions.
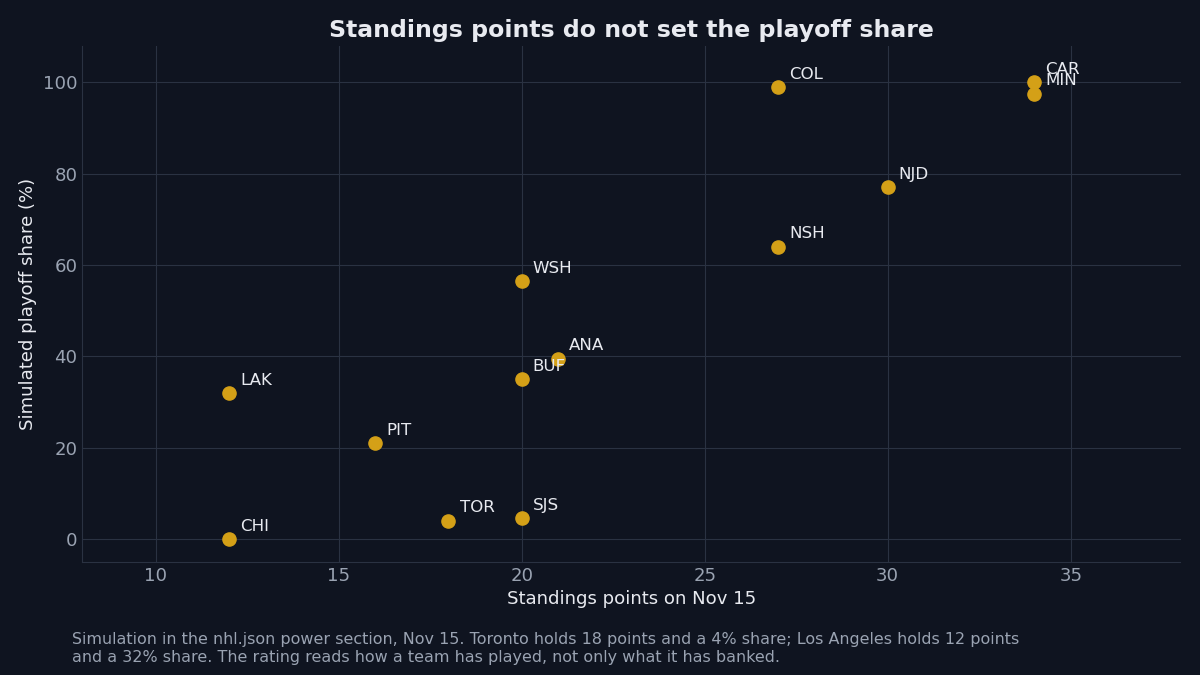
Toronto is the sharpest case today. Toronto holds 18 points from 22 games, yet the simulation gives Toronto a 4% playoff share. The rating places Toronto 26th of 32 teams, with the 26th-ranked attack and the 23rd-ranked defence. The record says a team in the mix; the rating says results have run ahead of the play so far.
Los Angeles points the other way. Los Angeles holds only 12 points from 18 games, yet holds a 32% playoff share, ahead of Pittsburgh at 21% on 16 points and San Jose at 4.5% on 20 points. San Jose holds more points than Los Angeles and a much smaller share: the rating places San Jose 30th, with the 28th-ranked attack. On the same 20 points, Washington holds 56.5% and Buffalo 35%.
None of this says the points are wrong. Points are real; the rating is a read on what the points are made of. When the two disagree, one moves toward the other over time.
The numbers move every night
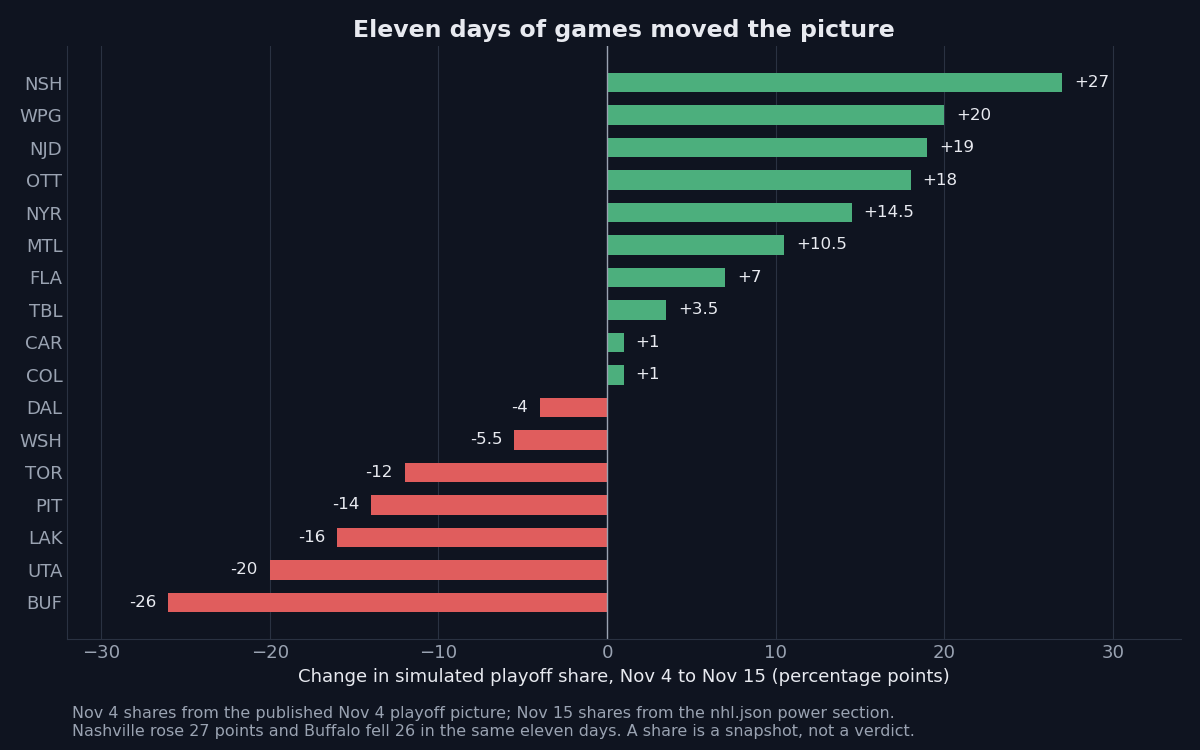
A share is a snapshot, and eleven days is enough to redraw it. Between November 4 and November 15, Nashville rose from 37% to 64%, a rise of 27 points. Winnipeg rose from 18% to 38%, New Jersey from 58% to 77%, and Ottawa from 65% to 83%. The moves the other way were just as large: Buffalo fell from 61% to 35%, Utah from 83% to 63%, Los Angeles from 48% to 32%, Pittsburgh from 35% to 21%, and Toronto from 16% to 4%.
At the top the picture barely moved. Carolina went from 99% to 100% for the playoffs and from 21% to 24.5% for the Cup, with simulated points rising from 115 to 119.5. Colorado went from 98% to 99% for the playoffs and from 17% to 18.5% for the Cup. The ratings moved the same way: Minnesota rose from 1567 to 1577.5, Edmonton from 1554 to 1558.5, Dallas fell from 1570 to 1564.5, Washington from 1533 to 1528.5, and Vegas rose from 1555 to 1561.5.
Movement in November is normal. A rating built on about 20 games changes quickly, and the simulation changes with it.
What a percentage does not know
The simulation knows only the ratings and rosters of today. It does not know about injuries to come, trades to come, or a goalie run that changes a season. Its value is in showing where the standings and the underlying play disagree, and how large that disagreement is.
Read a playoff percentage in three steps. First, read the ladder: a 99% playoff share with a 47.5% division share is a different team from a 99% with a 91.5% division share. Second, set the share against the points: a wide gap is the rating saying something the standings do not. Third, watch the movement: a share climbing 20 points in eleven days is a rating changing its mind fast.
The teams to watch are the ones where points and share disagree most: Toronto at 18 points and 4%, Los Angeles at 12 points and 32%, San Jose at 20 points and 4.5%. Over the next month, either the points drift toward the simulation, or the simulation drifts toward the points.
21+. If gambling stops being fun, call or text 1-800-GAMBLER.