How to read an NHL power rating: one number, three parts, and a whole season behind it
A rating is not the standings
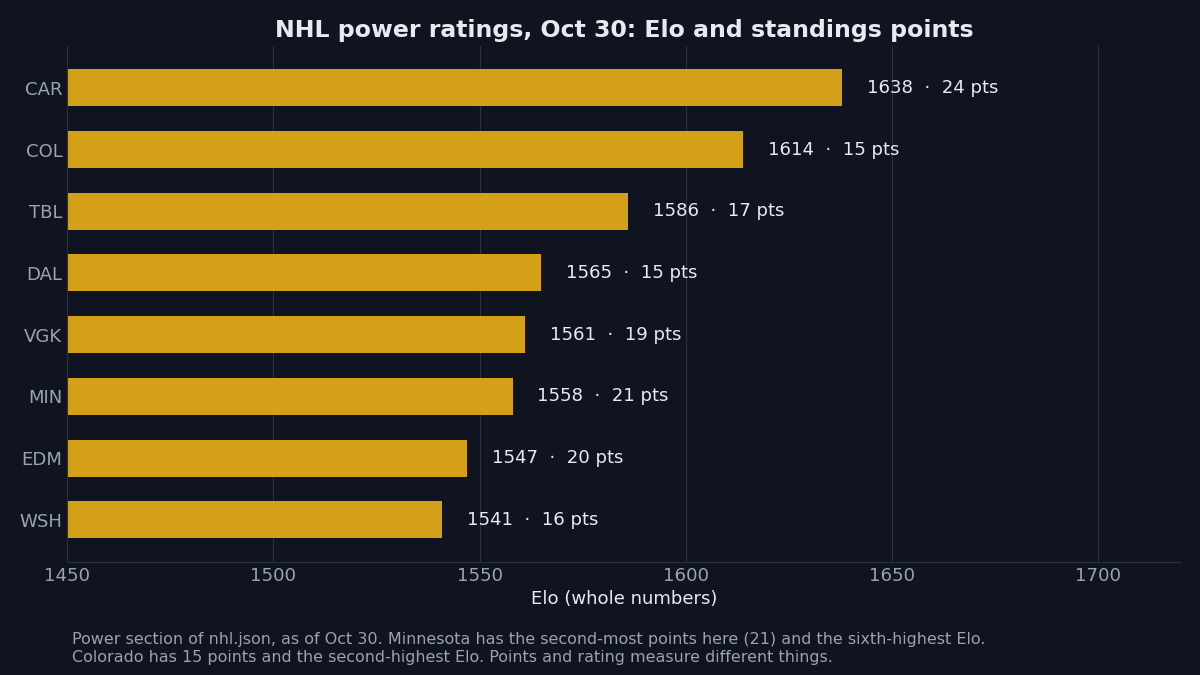
On October 30, Carolina sat at the top of the rating list with an Elo of 1638 and a record of 11 wins, 2 losses, and 2 overtime losses for 24 points in 15 games. Colorado sat second with an Elo of 1614, 24 rating points behind Carolina, on a record of 7 wins, 5 losses, and 1 overtime loss for 15 points in 13 games. The standings and the rating agree that Carolina is strong. They disagree about who belongs near the top at all. Minnesota had 21 points, the second-most among the eight teams shown in the first chart, and only the sixth-highest Elo. Colorado had 15 points and the second-highest Elo. Points count what already happened. A rating estimates how strong a team is right now, so it can disagree with the points column without either number being in error.
One number, three parts
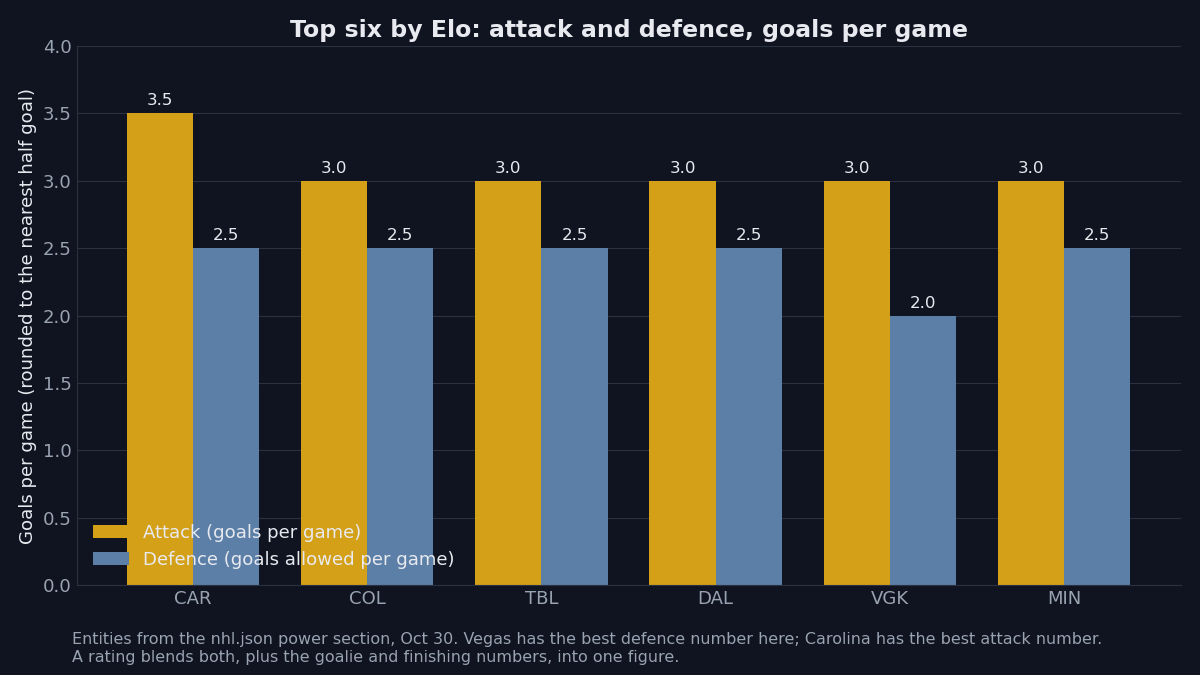
A rating on this site is built from the parts that decide hockey games: attack, how many goals a team creates per game; defence, how many goals a team allows per game; and the goalie and finishing numbers, who is in net, how much of the work that goalie is expected to share, and how well the team converts its chances. The feed lists each team with those numbers plus the roster they were built from, as of the morning of October 30. A change in goalie or lineup changes the rating.
The parts explain the headline number. Carolina had the best attack number in the league and the second-best defence number, which is why its Elo leads the list. Vegas had the best defence number in the league, which lifts its rating even though its attack number sat in the middle of the pack. Edmonton had the best finishing number in the league, which helps explain a rating near the top despite attack and defence numbers that sat in the middle. Ottawa showed the other shape: the third-best defence number with an attack number ranked 17th, a team carried more by keeping goals out than by scoring them.
From a rating to a game
A rating becomes a game prediction by turning the two teams and the setting into expected goals. Detroit against Chicago on October 29 shows the working. Each team started from the same league base, about 2.5 goals per team per game. Detroit added small pieces for its attack, its defence, home ice, and its lineup, while the opposing goalie piece pulled a little back. Chicago subtracted small pieces for its attack and defence and for its lineup. The result was an expected score of about 3.5 goals for Detroit and about 2.5 goals for Chicago. From those expected goals, the model produced a win chance of 66% for Detroit, against a market chance of 59%, and a 46% chance on the puck line against a market chance of 37%. Detroit won 4-1, with John Gibson confirmed in goal for Detroit and Spencer Knight the likely starter for Chicago.
The rating is only the starting point for a game. Rest, back-to-back games, the confirmed goalie, and the lineup on the night all enter as separate pieces in the same calculation. The rating says how strong each team is in general. The game calculation says how strong each team is on that night, in that building, with that goalie.
From a rating to a season
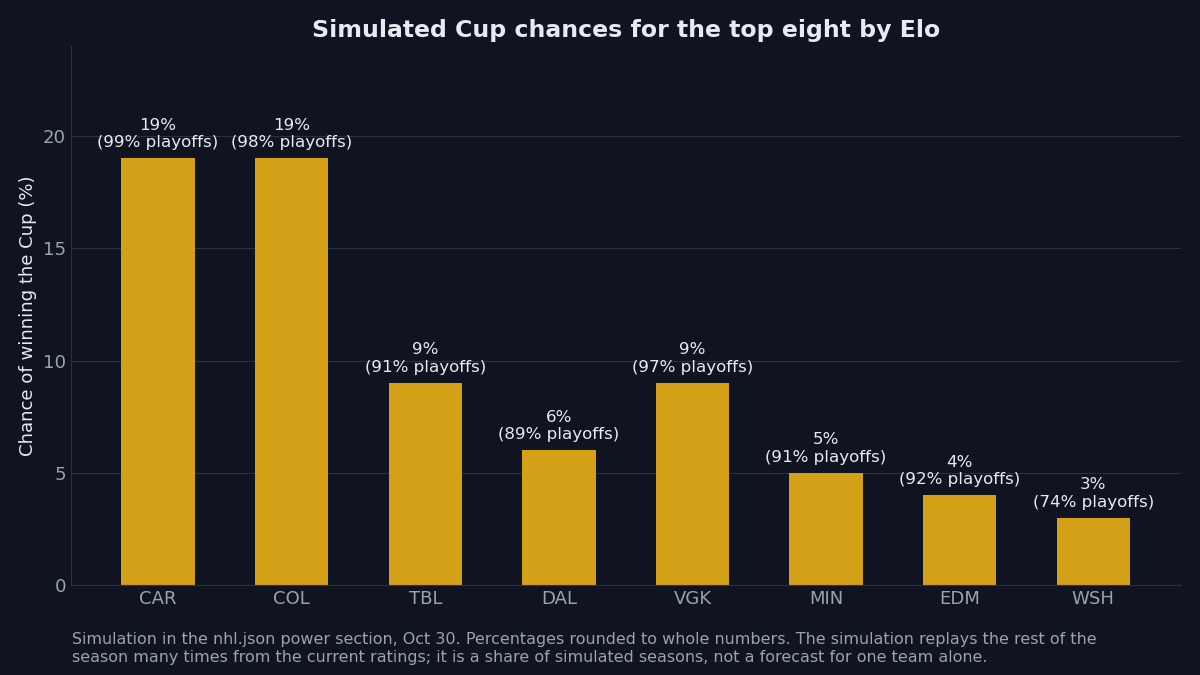
The same ratings drive the season simulation. The simulation replays the rest of the season many times from the current ratings, the remaining schedule, and the current rosters, and counts how often each outcome happens. Carolina came out at about 115 points with a 99% chance of reaching the playoffs and a 19% chance of winning the Cup. Colorado came out at about 111 points with a 98% chance of reaching the playoffs and a 19% chance of winning the Cup. The two teams share the same Cup number despite a 24-point Elo gap and a 9-point gap in standings points, because the simulation also weighs the schedule ahead and the closeness of the race, not the rating alone. Washington shows the other end of the top eight: an Elo of 1541, about 100 simulated points, a 74% chance of reaching the playoffs, and a 3% chance of winning the Cup, on an attack number ranked fifth and a defence number ranked 25th.
Simulation numbers are shares of simulated seasons. A 19% Cup chance means the team won about 19 of every 100 simulated seasons. Early in the season, with 12 to 15 games played for the teams at the top of the list, one week of results moves the simulation more than the same week would move it in March. A simulation number is a summary of where a team stands today, given everything the rating knows so far.
How to read a rating on a game page
Start with the gap between the two ratings, not with either rating alone. A gap of 24 rating points, like the gap between Carolina and Colorado, is a real difference in estimated strength, but it is not a margin on the scoreboard. Next, look at the parts: whether the gap comes from attack, from defence, or from the goalie. Then check the night itself: the confirmed goalie, rest, and the lineup pieces, because those move the expected goals after the rating has done its work. Finally, compare the model's number with the market's number in the same market, to the nearest half point, and let trends add context around the comparison. A rating tells you how strong a team is. The market comparison tells you how much of that strength the price already reflects.
21+. If gambling stops being fun, call or text 1-800-GAMBLER.