The NHL playoff picture on November 4: what the simulation sees that the standings do not
A snapshot from the simulation
On November 4, the season simulation in the site power ratings gives Carolina a 99% share of simulated seasons reaching the playoffs and a 21% share winning the Cup. Colorado sits at 98% for the playoffs and 17% for the Cup. Carolina also leads the simulated points race at 115 points, with Colorado next at 110 points. No other team reaches 10% for the Cup.
A simulation is a way of reading a rating, not a separate opinion. It replays the rest of the season many times from the current ratings and rosters, with rosters as of the morning of November 4, and it counts how often each outcome comes up. A 99% playoff share means Carolina reached the playoffs in 99 of every 100 simulated seasons. The shares describe the rating as it stands today, and they move after every night of games.
Points and a rating measure different things. Points count what has already happened. A rating weighs how a team has played, who it has played, and who is in the lineup now, and it projects that forward. Early in a season, the two can point in different directions. That is where this picture gets interesting.
The East: eight in, and a crowded line behind them
In the East, the simulation puts eight teams above 58% for the playoffs: Carolina at 99%, Tampa Bay at 92%, Montreal at 67%, Ottawa at 65%, Boston at 65%, Washington at 62%, Buffalo at 61%, and Florida at 58%. New Jersey also sits at 58%, first out on simulated points: Florida is projected at 97 points and New Jersey at 96 points. The Rangers follow at 37%.
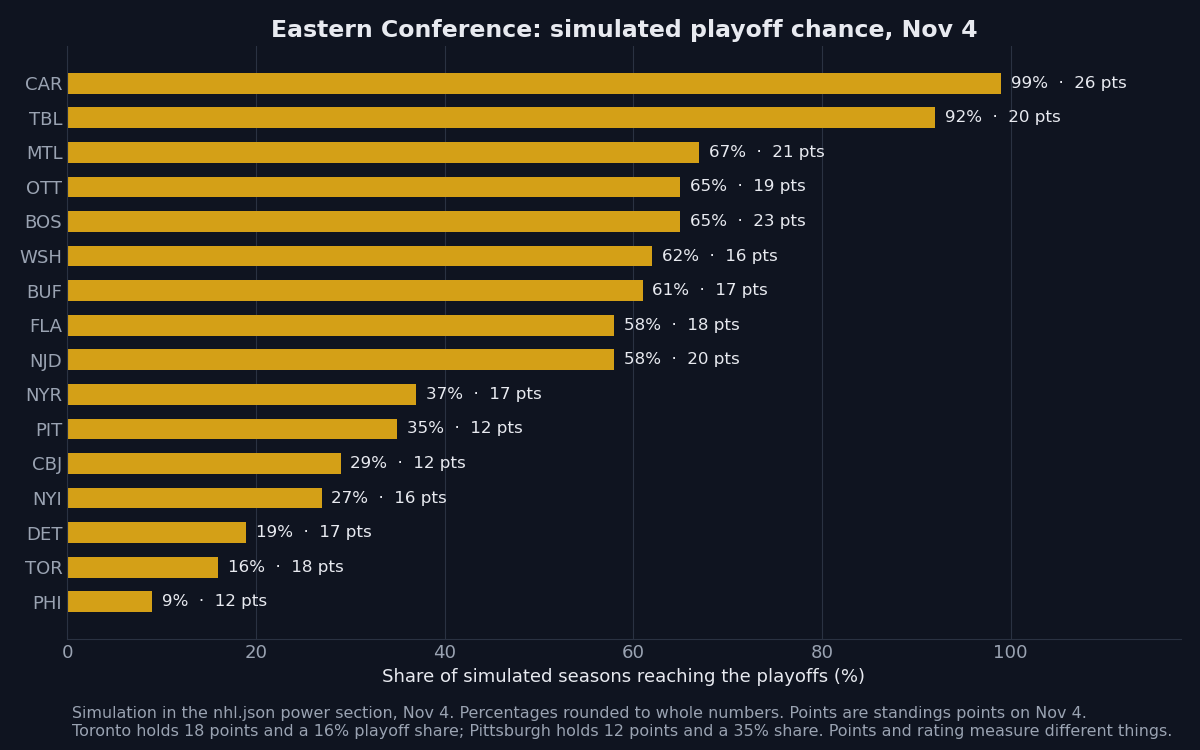
The East also holds the sharpest disagreement between points and rating. Toronto holds 18 points, level with Florida and one point behind Ottawa, yet the simulation gives Toronto only a 16% playoff share. The rating places Toronto 23rd of 32 teams, with the 26th-ranked attack and the 25th-ranked defence in the power section. The record says a playoff team. The rating says a team whose results have run ahead of its play so far.
Pittsburgh points the other way. Pittsburgh holds only 12 points, yet the simulation gives Pittsburgh a 35% playoff share, ahead of Columbus at 29%, the Islanders at 27%, Detroit at 19%, and Toronto at 16%. The rating places Pittsburgh 12th, with the sixth-ranked attack. Washington is a quieter version of the same story: 16 points in the standings and a 62% playoff share in the simulation, with the fifth-ranked attack.
The West: Colorado leads the rating, not the points race
In the West, the simulation puts six teams at 83% or better: Colorado at 98%, Vegas at 96%, Edmonton at 96%, Minnesota at 94%, Dallas at 92%, and Utah at 83%. St. Louis at 51% and Los Angeles at 48% hold the last two simulated spots. Seattle at 39% and Nashville at 37% are the first teams out, close behind Los Angeles.
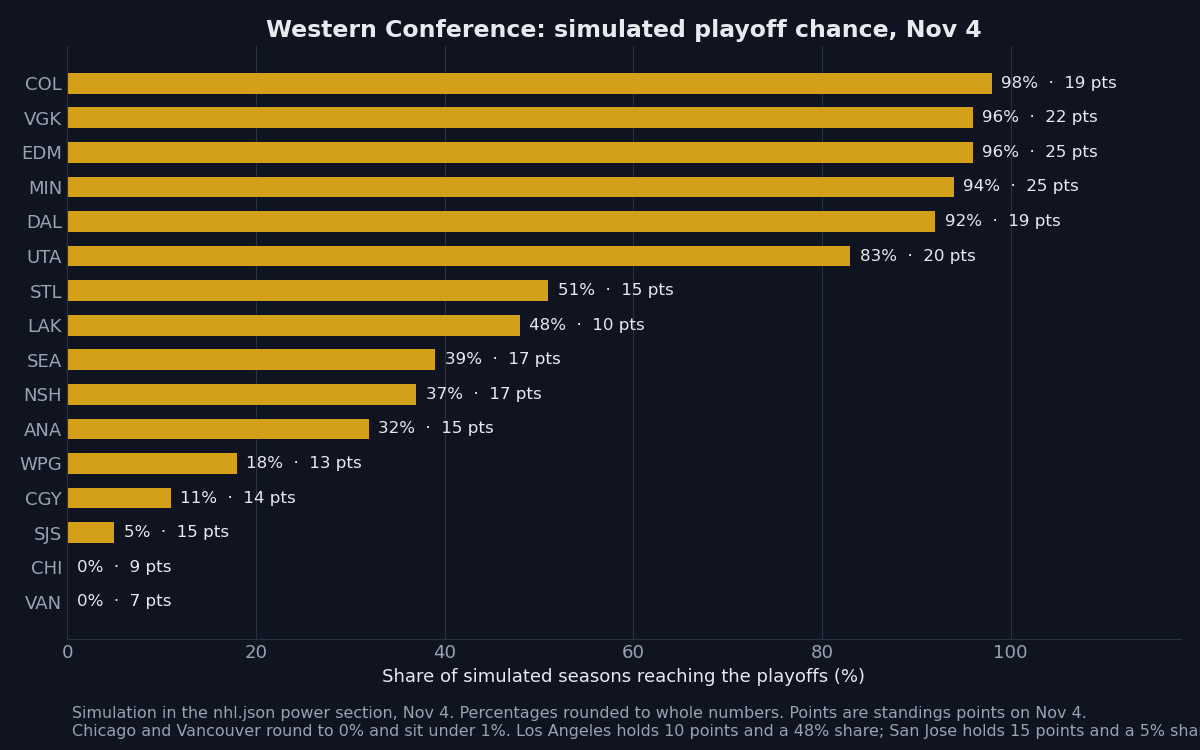
Colorado is the clearest case of a rating running ahead of the points. Colorado holds 19 points from 16 games, well behind Minnesota and Edmonton at 25 points each, yet the simulation gives Colorado a 98% playoff share and 110 simulated points, second only to Carolina. The rating places Colorado second overall, with the second-ranked attack. Games in hand explain part of the points gap, and the rating explains the rest.
Los Angeles and San Jose show the same split from opposite sides. Los Angeles holds only 10 points from 13 games, yet holds a 48% playoff share. San Jose holds 15 points, yet holds only a 5% share, with the 30th-ranked defence in the rating.
Movement since October 30
The simulation has already moved since the power ratings were last written about on October 30. Minnesota has moved up the most among the top eight, with its rating rising from 1558 to 1567 and its playoff share rising from 91% to 94%. Edmonton has risen from 1547 to 1554, and Dallas from 1565 to 1570. Washington has moved the other way, falling from 1541 to 1533, with its playoff share falling from 74% to 62%. Vegas has slipped from 1561 to 1555, while its playoff share has held near the top at 96%.
The Cup shares have moved with the ratings. Carolina has risen from 19% to 21%. Colorado has eased from 19% to 17%. The two teams still hold 38 of every 100 simulated Cups between them, more than four times the share of the next team. Movement in November is normal: a rating built on 15 or 16 games changes quickly, and the simulation changes with it.
The Cup picture, and how to read it
Behind Carolina and Colorado, Tampa Bay sits at 9% for the Cup, Vegas at 8%, Dallas at 7%, and Minnesota at 5%. Edmonton and Ottawa sit at 4% each, and Utah also rounds to 4%. The division shares add one more layer: Carolina holds an 83% share to win the Metropolitan Division, Edmonton holds a 47% share to win the Central Division, and Vegas holds a 46% share to win the Pacific Division.
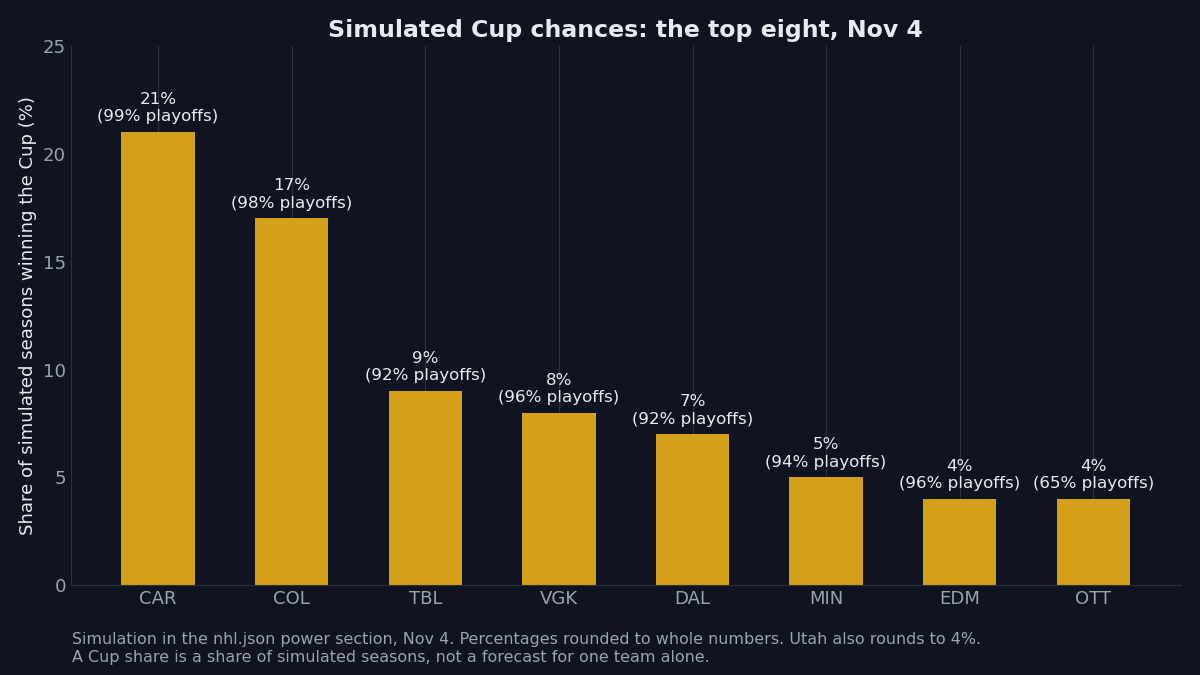
Read this picture as a snapshot, not a verdict. The simulation knows only the ratings and rosters of November 4. It does not know about injuries to come, trades to come, or a goalie run that changes a season. Its value is in showing where the standings and the underlying play disagree, and how large that disagreement is. Toronto, Los Angeles, and San Jose are the three names to watch: if the ratings are reading the play right, the points will drift toward the simulation over time. If the points hold, the ratings will drift toward the points instead.
21+. If gambling stops being fun, call or text 1-800-GAMBLER.