What variance is, and why a 60% model still loses 4 of 10
The short version
A model that wins 60% of its picks loses 4 out of 10 on average. Those four losses are not a sign that something broke. They are part of the 60%. Variance is the gap between what should happen over a long run and what happens in any one short stretch. If you judge a model by a night, a weekend, or even a month, you are mostly judging variance.
Ten bets tell you almost nothing
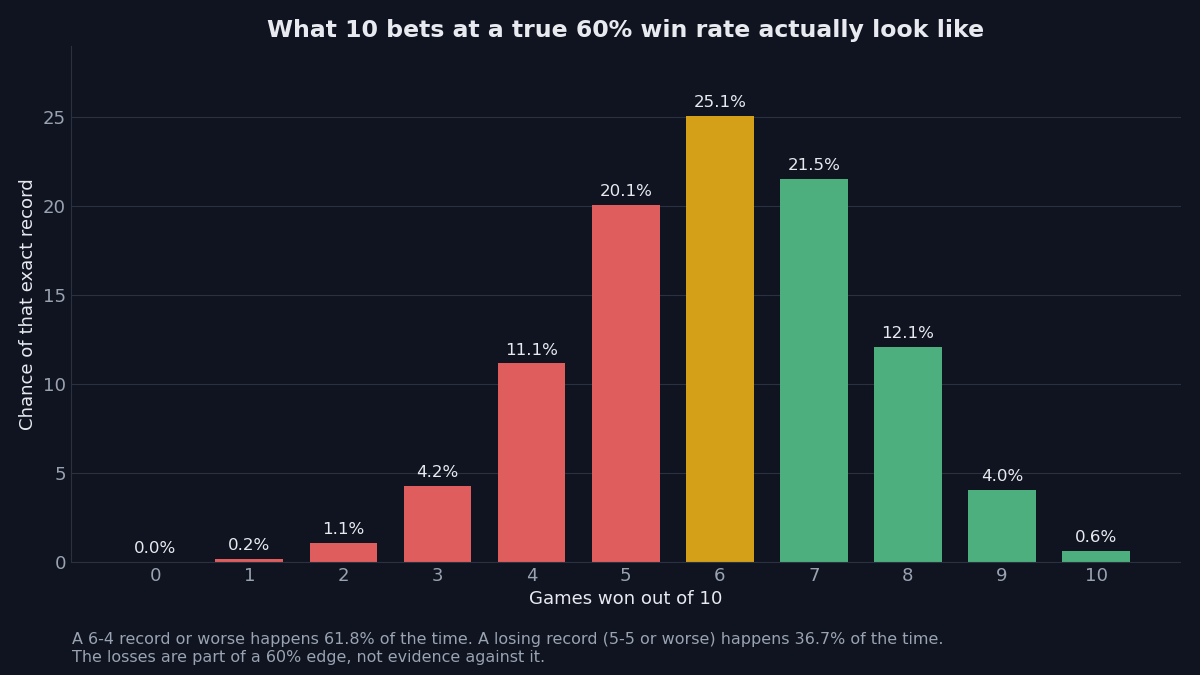
Picture a model with a genuine 60% edge on every pick, priced at -110. Over the next 10 picks, the single most likely record is 6-4, and it happens only about one time in four (25.1%).
The rest of the time, the record spreads out: 7-3 happens 21.5% of the time, 5-5 happens 20.1% of the time, and 4-6 happens 11.2% of the time. Add it up, and a 6-4 record or worse shows up 61.8% of the time. A record of 5-5 or worse, a losing result after the juice, shows up 36.7% of the time, more than one stretch in three.
That is the part people miss. A real edge does not produce a steady drip of wins. It produces clumps: good weeks, flat weeks, and losing weeks, in an order nobody can predict. Ten picks is not a sample. It is a snapshot of noise.
A hundred bets tell you much more
Stretch the same 60% edge over 100 picks and the picture sharpens. The expected result is 60 wins, and the typical range is about 50 to 70 wins, two standard deviations either way. A losing record over 100 picks drops to a 1.7% chance.
This is why the record on this site is published in full, pick by pick, instead of as highlights. One night proves nothing. A few hundred picks start to say something real. Through October 26, the graded card here held 638 picks with a strength rating. That is the kind of sample where an edge, or the lack of one, begins to show.
The juice moves the bar
At -110, a pick needs to win 52.4% of the time just to break even. A model that wins 52% of its picks can be a good forecasting model and still finish behind after the juice. The margin between a good model and a profitable record is thin, and thin margins need big samples before anyone can call them real.
The NHL card this season shows both sides of that bar. The puck line sits at 42-32 (56.8%) and +20.00u. Totals sit at 53-53 (50.0%) and -4.50u. Same site, same season, same model family. The difference is how far each market clears the bar, and how the results landed.
How to read a losing week on this site
The six weeks from September 21 through October 26 are a clean example. Week 40 finished +6.87u. Week 41 finished +5.61u. The running total peaked at +12.30u. Then Week 42 finished -19.19u, and the running total fell to -6.90u in seven days.
Nothing about the model changed between Week 41 and Week 42 that explains a 19-unit swing. The schedule changed, the bounces changed, and a few close games landed on the wrong side. Week 43 finished +0.59u, nearly flat. After six weeks and 638 picks, the running total sits at -5.45u, close to break-even, with individual markets running hot and cold underneath it.
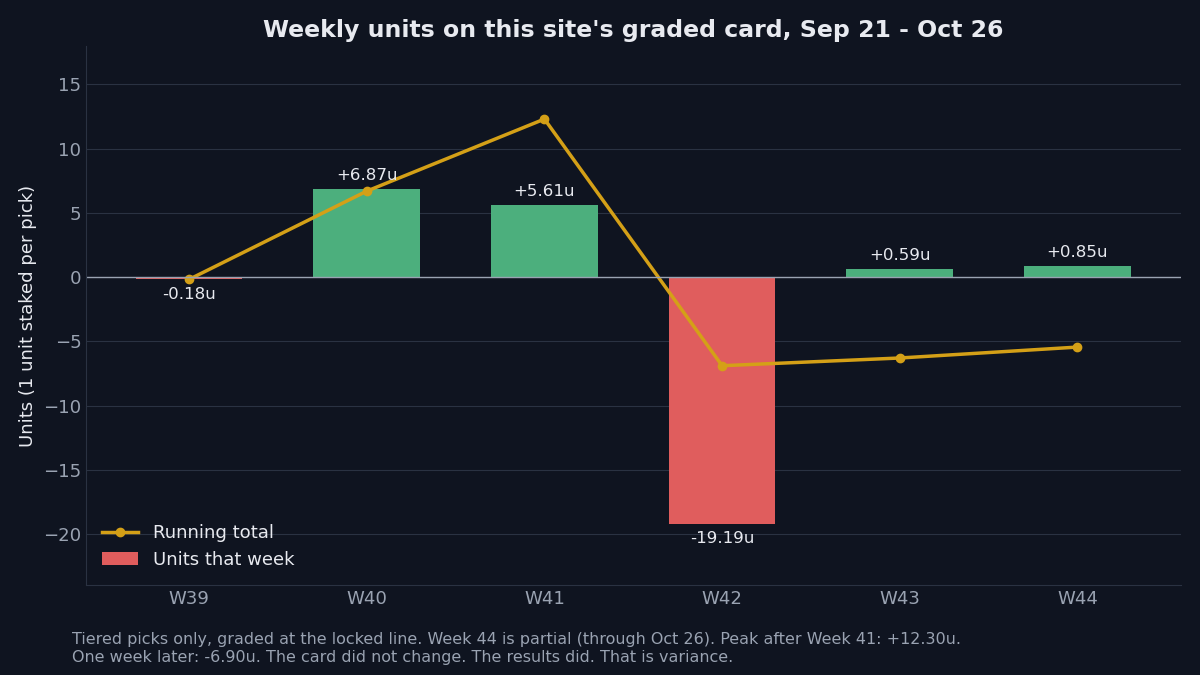
That is what variance looks like in the wild: not a theory, but a +12.30u peak turning into a -6.90u total in one week, on the same process. The response is not to rebuild the model after a bad week or to celebrate it after a good one. The response is to keep grading every pick at the line it locked at, keep the record complete, and let the sample grow.
What variance is not
Variance is not a cover story for a model that never wins. Over hundreds of picks, a real edge shows up in the record, and the absence of one shows up too. It is not a pattern to time, either: a cold week does not make the next week "due," and a hot week does not make the next one safe. And it is not a reason to change anything after one result, not the model, not the process, and not how the record is kept.
The honest way to read any short stretch is to ask two questions. How big is the sample? And is the record complete, wins and losses both? If the sample is small, the answer is to wait. If the record is complete, the wait is worth it.
21+. If gambling stops being fun, call or text 1-800-GAMBLER.