Week 10: three gaps that show what a model number is saying
Three games, three shapes of disagreement
A gap is the distance between two numbers: the model's number and the market's number. The three Week 10 games in this piece all have wide gaps, and the gaps are wide in different ways. In one game the two numbers agree on the favorite and disagree on the size of the margin. In the second they agree on the favorite and disagree by even more. In the third they do not agree on the favorite at all.
The numbers here come from the site feed on November 3, rounded to the nearest half point. Lines move, and the numbers in this piece will move with them. The comparison that counts for grading is the model's number against the market's number at the lock, two hours before kickoff, not the opening line. A gap describes the size of a disagreement. On the spread, the site's own testing across thousands of completed games found that the size of the disagreement, on its own, did not predict the result. A wide gap is a wide disagreement, and nothing more than that. The totals work differently: one point of total disagreement has a measured relationship with the result, and that relationship is what sets the strength of a total call.
Ohio at Akron: the same favorite, a smaller margin, a higher total
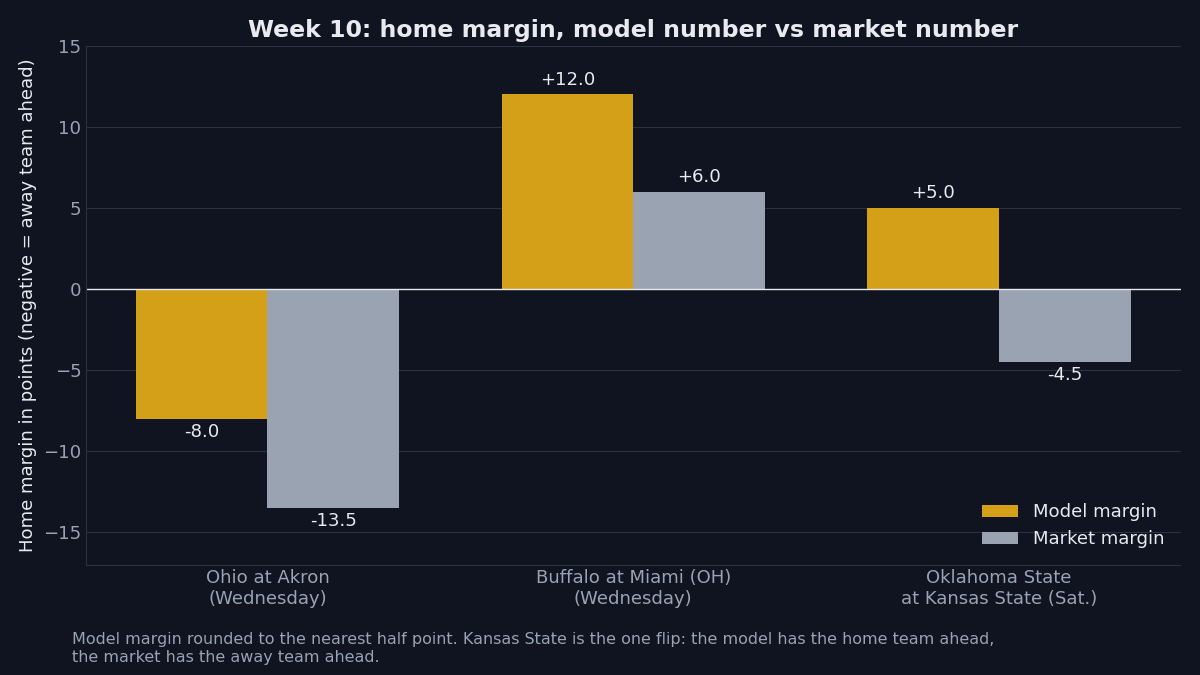
Ohio is the favorite in both numbers at Akron on Wednesday. The market has Ohio by 13.5 points. The model has Ohio by 8.0 points. The gap is 5.5 points, and the model sees a closer game than the market sees. The projected score in the feed is Ohio 33, Akron 25, an 8 point margin that matches the model number.
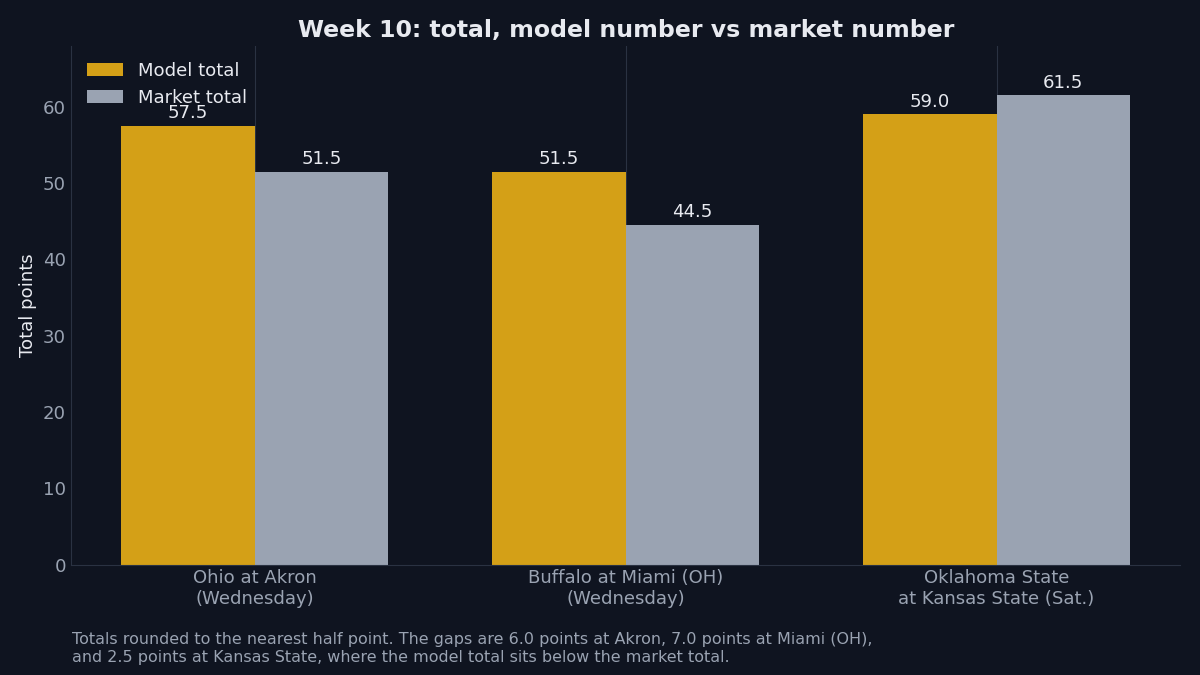
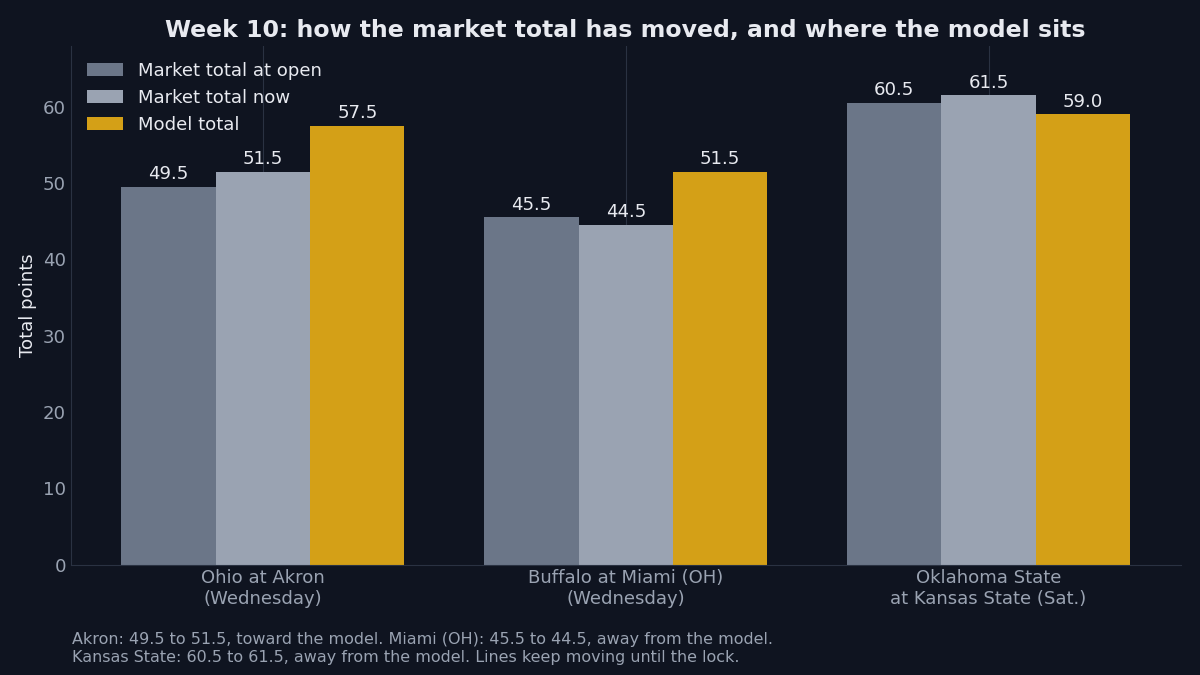
The total tells the other half of the story. The model total is 57.5 points. The market total is 51.5 points. The gap is 6.0 points, with the model expecting more scoring than the market expects. The spread call in the feed is Akron plus 13.5, in the moderate tier. Both teams had 11 days of rest, so rest does not separate them here. The total opened at 49.5 and now sits at 51.5, moving toward the model number, while the spread opened at Ohio by 12.5 and now sits at Ohio by 13.5, moving away from it.
Buffalo at Miami (OH): the same favorite, a wider margin, a higher total
Miami (OH) is the favorite in both numbers against Buffalo on Wednesday, and here the model goes further than the market. The model has Miami (OH) by 12.0 points. The market has Miami (OH) by 6.0 points. The gap is 6.0 points. The projected score is Miami (OH) 32, Buffalo 20, a 12 point margin that matches the model number. The spread call in the feed is Miami (OH) minus 6, in the strong tier.
The total gap is wider still. The model total is 51.5 points. The market total is 44.5 points. The gap is 7.0 points, the widest total gap of the three games. Both lines have moved away from the model since the open: the spread from 6.5 to 6.0, and the total from 45.5 to 44.5. Both teams had 11 days of rest, and both arrived on a run of three wins in a row. That context sits around the numbers. It does not change them.
Oklahoma State at Kansas State: the favorite flips
Saturday brings the clearest example of what a gap can mean. The market has Oklahoma State by 4.5 points at Kansas State. The model has Kansas State by 5.0 points. The two numbers name different favorites, and the distance between them is 9.5 points, the widest spread gap in this piece. The projected score is Kansas State 32, Oklahoma State 27, a 5 point margin for the home team. The spread call in the feed is Kansas State plus 4.5, in the strong tier.
The total in this game runs the other way. The model total is 59.0 points. The market total is 61.5 points. The gap is 2.5 points, with the model expecting less scoring than the market expects. It is the only one of the three games where the model total sits below the market total, and the smallest total gap of the three. The market spread has moved toward the model since the open, from Oklahoma State by 6.5 to Oklahoma State by 4.5, while the total has moved the other way, from 60.5 to 61.5.
What to watch as the lines lock
Watch the total at Akron first. It has already moved 2.0 points toward the model number, and 6.0 points still separate the two numbers. Watch the spread at Kansas State next. It has moved 2.0 points toward the model number, and the favorite still differs between the two numbers. Watch the total at Miami (OH) as well. It has moved 1.0 point away from the model number, and 7.0 points separate the two numbers. In each case the question is the same: where do the two numbers sit at the lock, two hours before kickoff, when the comparison is fixed for grading.
A gap is a way of reading a card, not a way of reading a result before it happens. The model number and the market number are both estimates, built from different inputs. When they sit close together, there is little to explain. When they sit far apart, the distance itself is worth understanding: which team each number favors, by how much, and how much scoring each number expects. These three games show all three shapes of that distance in a single week.
21+. If gambling stops being fun, call or text 1-800-GAMBLER.