What a trend is, and why a trend is context rather than a pick
A trend beside a pick looks like a second opinion. It is not. A pick comes from the model's number for this game, set against the market's number at the lock. A trend comes from history: how games in a similar spot have played out before. Read it as background.
What a trend row actually says
Every trend row names a slice of history, the slice inside it, the bet it covers, and what happened before.
The record is shown two ways. One side counts the games where the side opposite the model's label won. The other counts the games where the model's own side won. Both counts sit in the same row in football.
New England at Chicago on October 23 shows the shape. The model lean on the total was Under 50.5, a moderate lean, with the model total at about 45. Around it sat 11 trend rows, every one pointing the other way, toward the Over. One band showed 19 against 42. The count beside each market read 11 against and none with the model lean on the total, and 1 against and none with it on the spread.
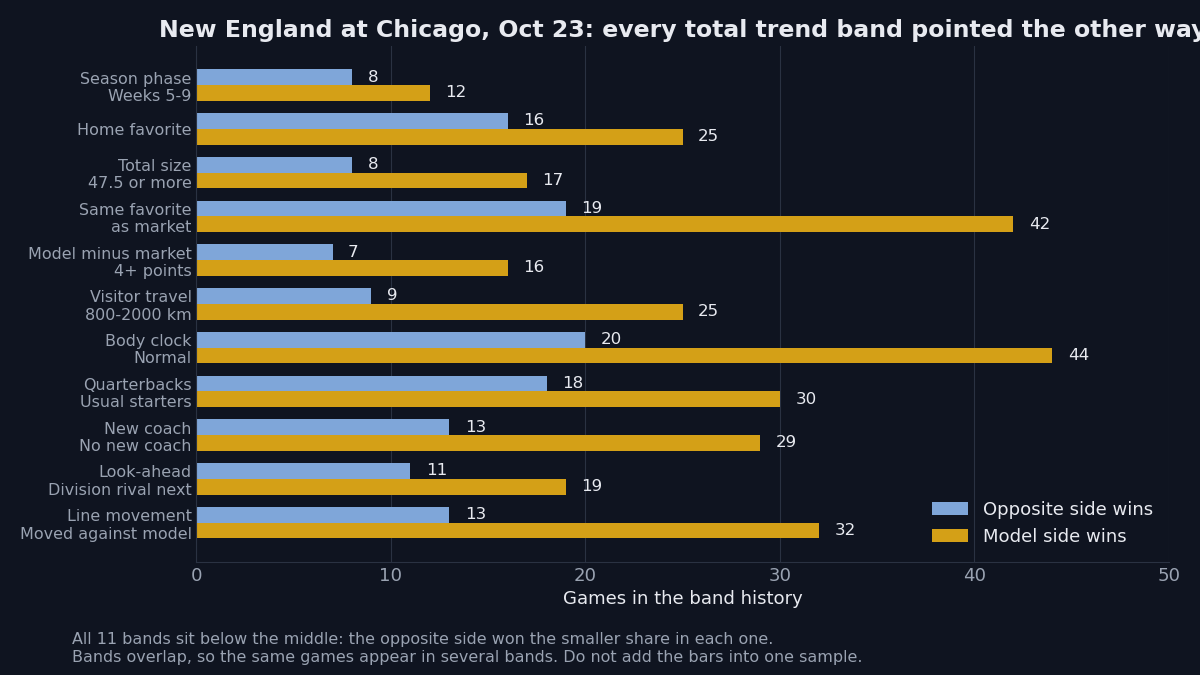
The slices are not separate games: the same past games appear in many bands at once.
The filter decides what you see
Only the loudest rows appear. The hockey page shows bands from 2024 through 2026, only when at least 20 games have been decided in the band and the record sits below 40% or above 60% for one side. The college page runs the same kind of filter over the 2026 season only.
The filter is why a page can look one-sided. One college game in the feed considered 50 bands, and only 2 breached the filter, against an expected count listed beside it.
An empty space carries the same lesson. Boston against Chicago on October 31 had trend rows on the moneyline and the puck line, and none on the total, although the total has history of its own.
Two games where history pointed the other way
In New England at Chicago, the final score was Chicago 30, New England 24, for 54 points. The spread lean and the moneyline lean won, and the total lean lost, as the Over cleared 50.5 by 3.5 points. Together the three leans finished at +0.55u. The two trend sides graded in the football journal finished the other way around as a pair: the Over won for +0.91u and New England +1.5 lost for -1.00u.
Boston against Chicago tells the same story from the hockey side. Two moneyline rows showed 72 against 126 and 28 against 56. The puck line row for games where the model backed the underdog showed 244 against 477. The results split: the Boston moneyline won for +0.42u and the Over 6.5 won for +1.14u, while the Boston puck line at -1.5 lost for -1.00u in overtime. The three leans together finished at +0.56u.
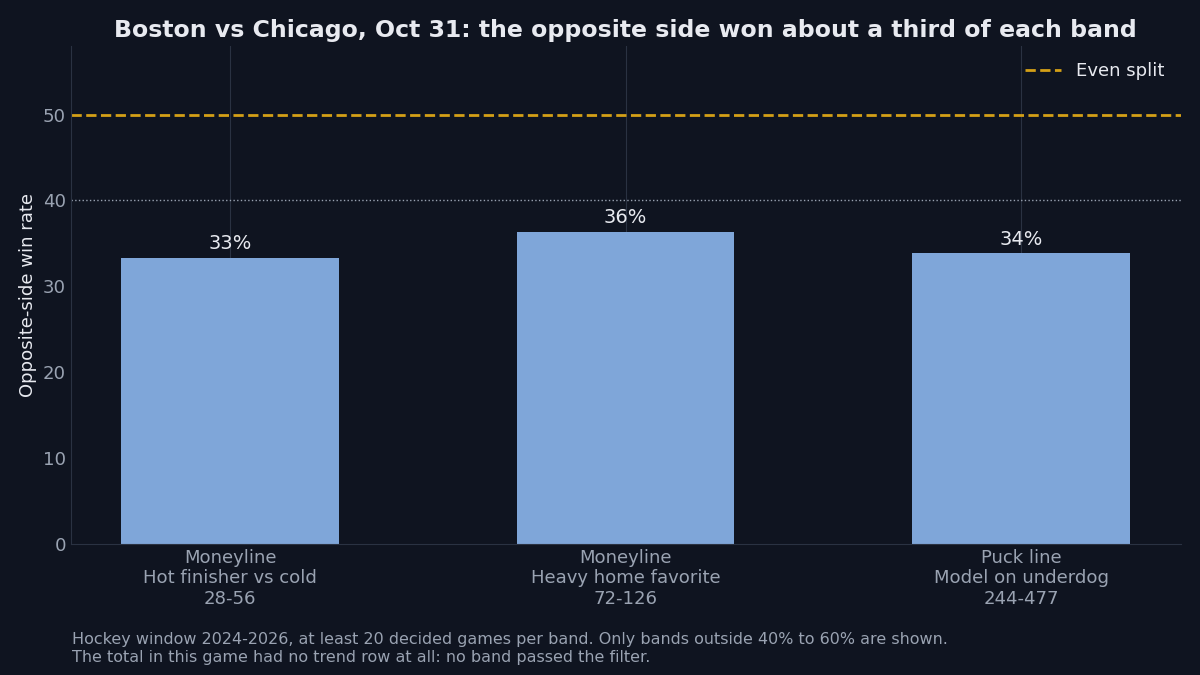
In hockey the trend rows are context on the game card only, not graded rows in the journal. In football the trend sides do appear in the journal, as rows with no strength label, graded at one unit each.
Why the strongest bands look so strong
The college page lists its strongest bands, and the numbers read high. The band for Big Ten totals shows the model side at 28 wins against 13. The band for pick'em spreads shows 36 against 19. The band for games where the line moved against the model shows 55 against 32. In whole numbers, those are model-side rates of about 68%, about 65%, and about 63%.
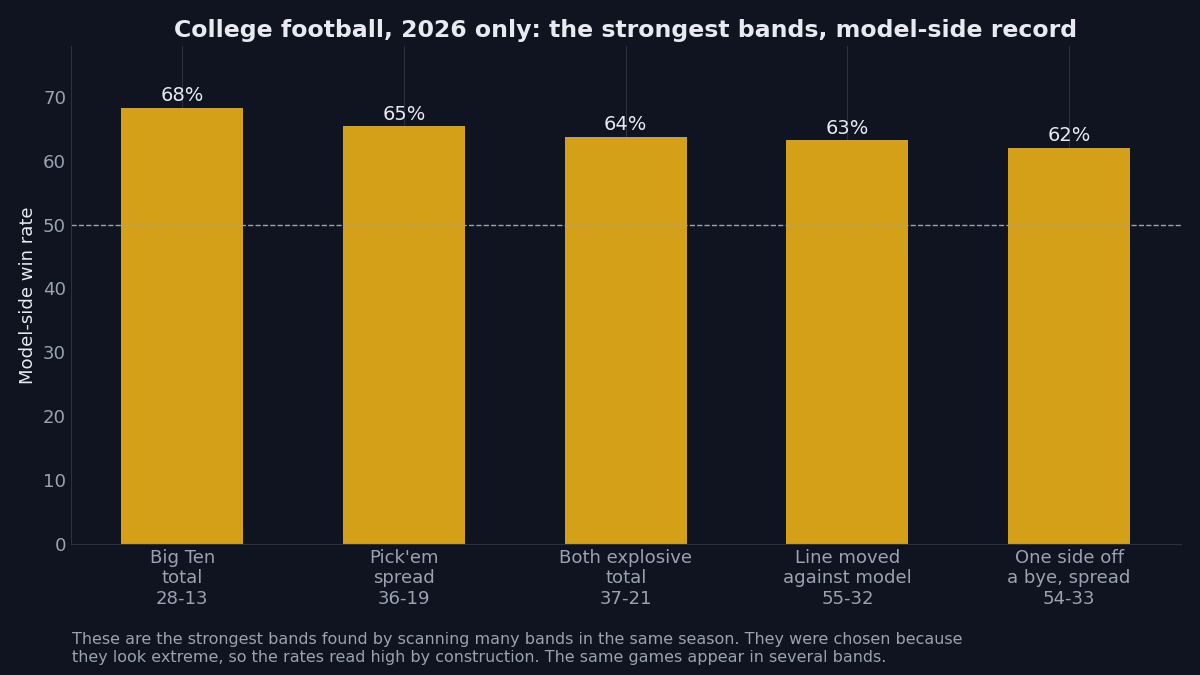
Read those rates with the filter in mind. The bands were picked out of a large set because their records sit at the extremes, using the same season they describe, so a rate measured on the games used to choose the band will read high by construction. It describes the past, not a rate for the next game. The bands also overlap: a game with a Big Ten total, a line that moved, and a team off a bye appears in three bands at once.
A band that keeps appearing, across seasons and across slices, is worth a closer look at why that spot behaves that way. A band that appears once, in one season, in a small sample, is worth far less. Ask how many games sit behind a row.
How to read the next trend
Ask four questions before a trend changes anything in your reading of a card. Which side does the row describe, the model's side or the opposite side? How many games sit behind it? A record of 244 against 477 says more than a record of 7 against 16. Which window does it cover? Does anything else on the page point the same way? One row is a note; several rows from different dimensions are still overlapping history, but a louder note.
Then leave the pick alone. A trend does not move a locked line, change a strength label, or alter the grading. The lock stays two hours before the start, and the grading stays at the locked line. A trend is the history around a game. The pick is the number for the game.
21+. If gambling stops being fun, call or text 1-800-GAMBLER.