What "the model vs the market" means: two numbers, one gap, and what the gap does not say
Every game page on this site shows two numbers side by side. One comes from the model. One comes from the market. The pick follows from the space between them. The model number says what the model expects: a margin, a total, or a chance of winning. The market line says what the market is offering: a spread, a total, or a moneyline price. A pick appears only when the two disagree by enough to clear the floor for that market, and the label on the pick, slight, moderate, or strong, says how large the disagreement is.
The model number and the market line
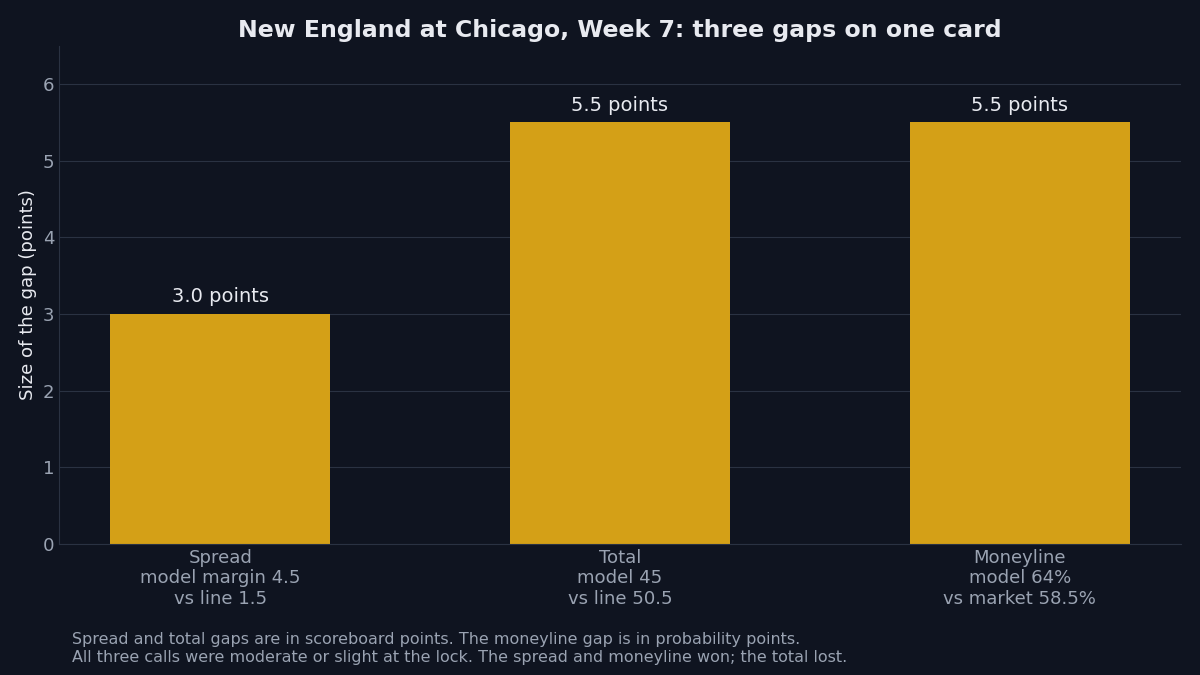
In Week 7, New England visited Chicago. The model put Chicago ahead by about 4.5 points, while the market line was Chicago -1.5. The disagreement is about 3 points: the model saw a larger Chicago margin than the market line asked for, and the card showed Chicago -1.5. On the total, the model total was about 45 points and the market total was 50.5 points, a gap of about 5.5 points with the model on the low side, so the card showed Under 50.5. The final score was Chicago 30, New England 24: 54 points and a Chicago margin of six points. Judged at the locked lines, Chicago -1.5 won and Under 50.5 lost.
A moneyline has no spread and no total, so the comparison is made in chances. In the same game, the model gave Chicago about a 64% chance to win outright, while the market price implied a chance of about 58.5%. The gap was about 5.5 points in probability, and the card showed the Chicago moneyline at -155.
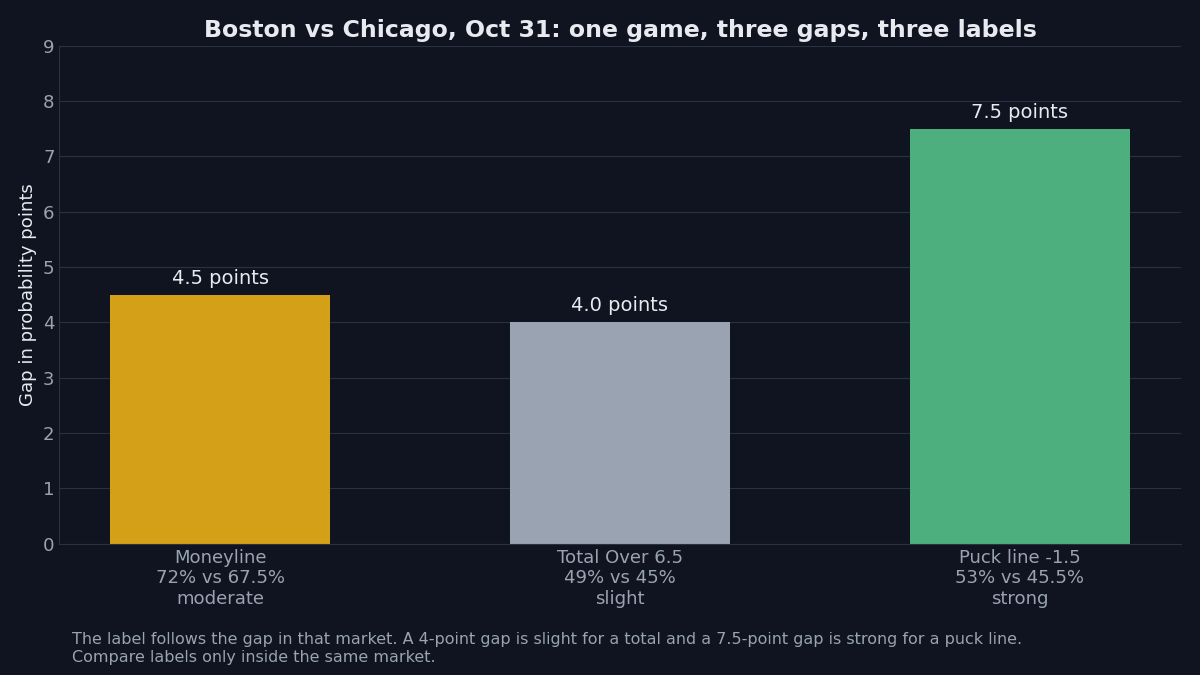
Hockey uses the same comparison. Boston against Chicago on October 31 shows all three gaps in one game. On the moneyline, the model put Boston at about 72%, against a market chance of about 67.5%, a gap of about 4.5 points, and the call read moderate. On the total, the model put Over 6.5 at about 49%, against a market chance of about 45%, a gap of about 4 points, and the call read slight. On the puck line, the model put Boston -1.5 at about 53%, against a market chance of about 45.5%, a gap of about 7.5 points, and the call read strong.
The gap is measured in each market's own units
A spread gap and a total gap are measured in scoreboard points. A moneyline gap and a puck line gap are measured in probability points. A gap of about 4 points is slight for a hockey total, as the Boston total shows, while a gap of about 5.5 points is moderate for a football total, as the Chicago total shows. The bands are set separately for each market, so labels should be compared only inside the same market. A disagreement below the floor for a market gets no label and does not appear as a pick.
The price does not set the label. Boston's moneyline sat at -238 and read moderate, while Boston's puck line sat at +110 and read strong. The price says what a win pays. The gap says how far apart the two numbers are. Read the price for the return, and read the gap for the disagreement.
Why a gap is not a result
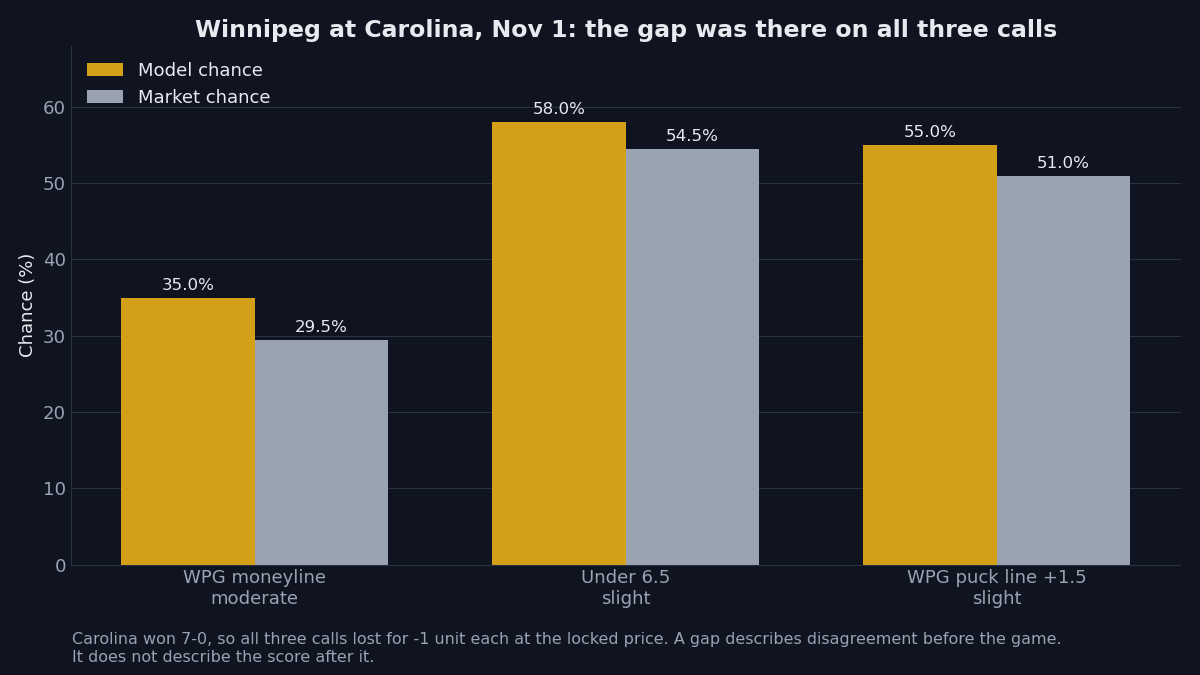
A gap describes disagreement before a game. It does not describe the score after it. Winnipeg at Carolina on November 1 is a clear recent case. The model gave Winnipeg about a 35% chance to win outright, against a market chance of about 29.5%, a gap of about 5.5 points, and the moneyline call read moderate at +225. On the total, the model gave Under 6.5 about a 58% chance, against a market chance of about 54.5%, a gap of about 3.5 points, and the call read slight at -130. On the puck line, the model gave Winnipeg +1.5 about a 55% chance, against a market chance of about 51%, a gap of about 4 points, and the call read slight at -115.
Carolina won 7-0. All three calls lost, each for one unit at its locked price. A side with a 35% chance wins about a third of the time, which means it loses about two thirds of the time. A gap says the model sees more value in a side than the market price suggests. It never says the side will win. In Week 7, four football moneyline calls carried the strong label, two won and two lost, and the four together finished ahead by about three and a half units because the two wins carried long prices.
How to read a game page, in order
Read the model number first: a margin, a total, or a chance. Read the market line second: a spread, a total, or a price. Read the gap third, through the label. Slight means the smallest disagreement shown, moderate means a larger one, and strong means the largest, in that market's own units. Read the price fourth, on its own, for what a win returns at the locked line. Read the trends last, as context. Trends describe how similar spots have played out before. They do not change the model number, the market line, or the gap.
When the two numbers agree, there is no pick, and that silence is information too: the model and the market see the game much the same way. When they disagree, the pick names the side the model number supports, at the market line as locked. Two numbers, one gap, and a clear record of both. The gap tells a reader where the model stands apart from the market. The game tells a reader the rest.
21+. If gambling stops being fun, call or text 1-800-GAMBLER.