What the price really means: implied probability and the vig
Every price on a card is a probability wearing a disguise. A moneyline of -500 does not only mean a heavy favorite. It means the market is charging you for an 83% chance. A price of +380 does not only mean a big underdog. It means the market is charging you for a 21% chance. Once you read prices that way, the whole card changes shape: a lean is not a hunch about who wins, it is a disagreement between two numbers, the model's chance and the market's chance. This piece shows how to turn any price into its implied chance, why the two sides of a game always add to more than 100%, and what that gap costs over a season.
How to turn a price into a chance
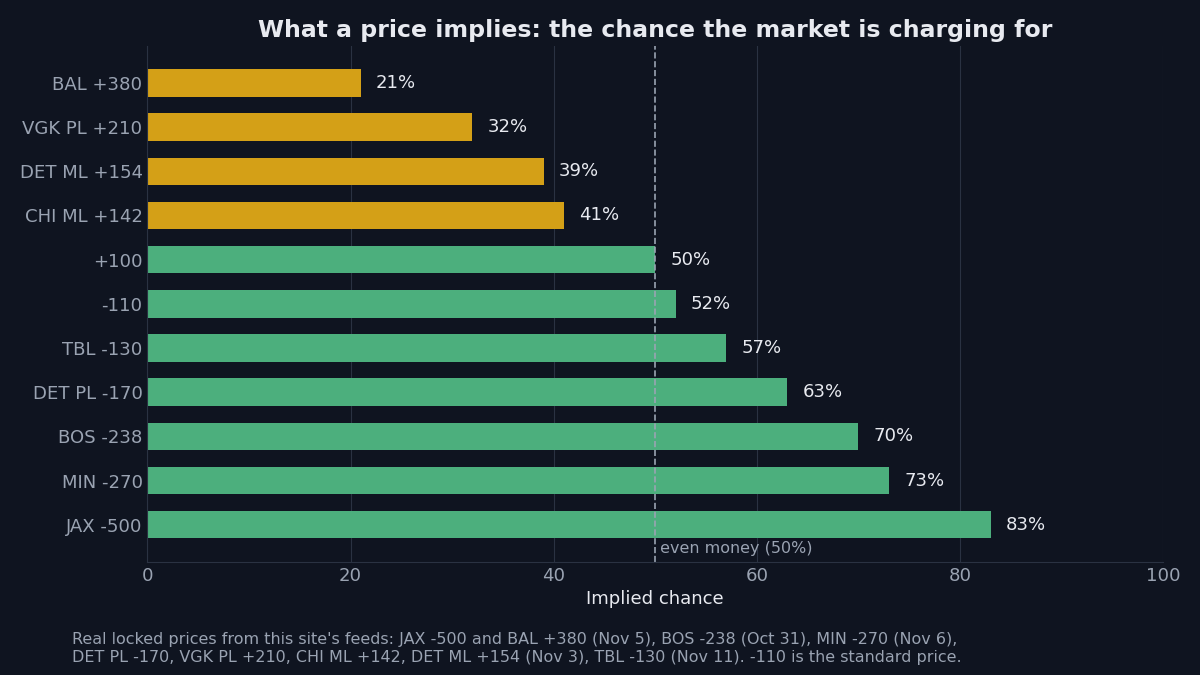
The rule is one division. For a minus price, divide the number by itself plus 100. Tampa Bay at -130: 130 divided by 230 is about 57%. For a plus price, divide 100 by the number plus 100. Vegas on the puck line at +210: 100 divided by 310 is about 32%. The standard -110 works the same way: 110 divided by 210 is about 52%. Even money, +100, is 100 divided by 200, or 50%.
The chart below runs the same math across real locked prices from this site's feeds, from -500 down to +380. Read it from the top: the heavier the favorite, the larger the chance the market charges for, and the smaller the chance left for the other side. A price of -500 charges for 83%. A price of +380 charges for 21%. Nothing else about the game has changed, only the price.
Why both sides add to more than 100
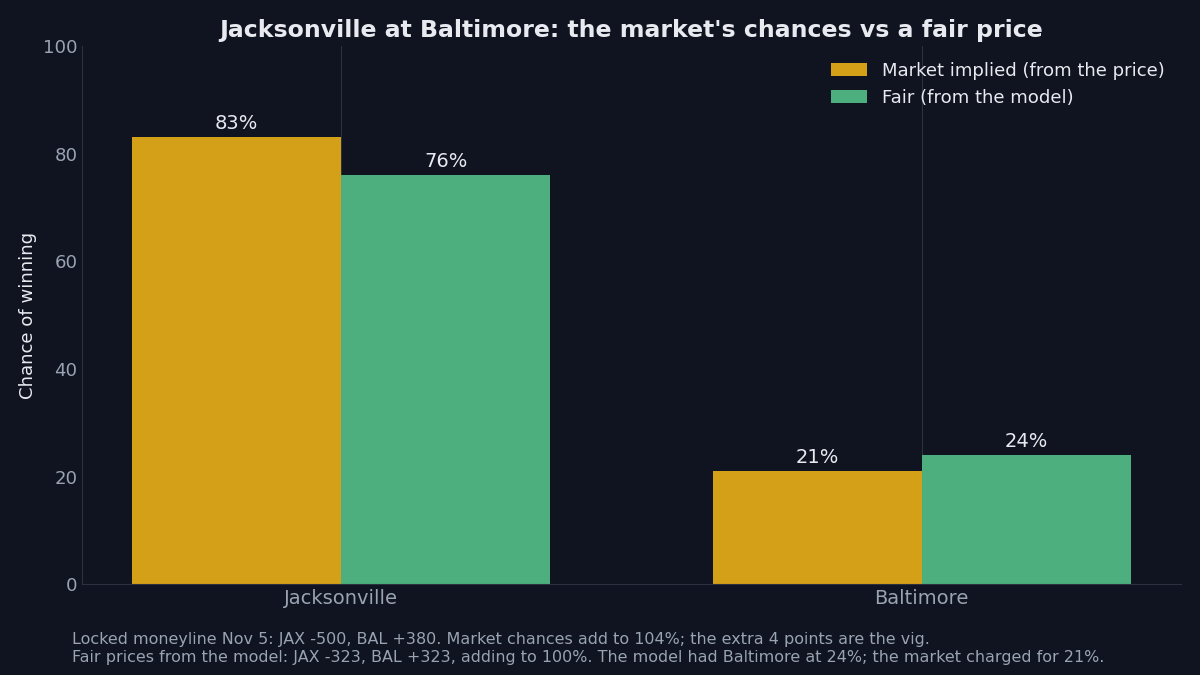
Add the two sides of any game together and the total is always more than 100%. Jacksonville at Baltimore, Nov 5: Jacksonville -500 implies 83%, Baltimore +380 implies 21%, and the two add to 104%. Calgary at New York, Nov 11: Calgary +120 implies 45%, the Rangers -142 implies 59%, and the two add to 104%. Two -110 prices imply 52% a side, or 104% between them. The extra points are the vig, the margin the book builds into every price. It is the reason a coin flip is not priced at +100 on both sides.
A fair price has no vig in it, so the two sides add to exactly 100%. The model publishes one for every game. Jacksonville at Baltimore again: the model's fair prices were Jacksonville -323 and Baltimore +323, which work out to 76% and 24%. The model had Baltimore winning 24 times in 100; the market charged for 21. That 3-point gap is why Baltimore's moneyline carried a slight label at +380. Jacksonville won 33-10, so the lean lost. The price can be right and the game can still go the other way, and that is a normal week on a graded card, not a broken model.
What the price demands from you
The implied chance is also a hurdle. At -500, you have to be right 83 times in 100 just to break even: five wins and one loss at that price leaves you exactly even. At -130, the bar is 57%. At -110, it is more than 52%, which is why a 50-50 record at the standard price loses money. The bar falls as the price rises: at +154, Detroit's moneyline at Florida on Nov 3, you only need to be right 39 times in 100. At +210, 32 times. At +380, one win in four still clears the bar.
That is the shape of the whole game. A favorite's price asks for accuracy; an underdog's price forgives misses. The model's job is to judge whether its own chance clears the bar the price sets. When the model says 24% and the market charges for 21%, the gap is small, and the label is slight. When the gap is wide, the label is strong. The price never changes what the model thinks will happen. It changes what the model thinks the chance is worth.
Why win rate alone does not pay
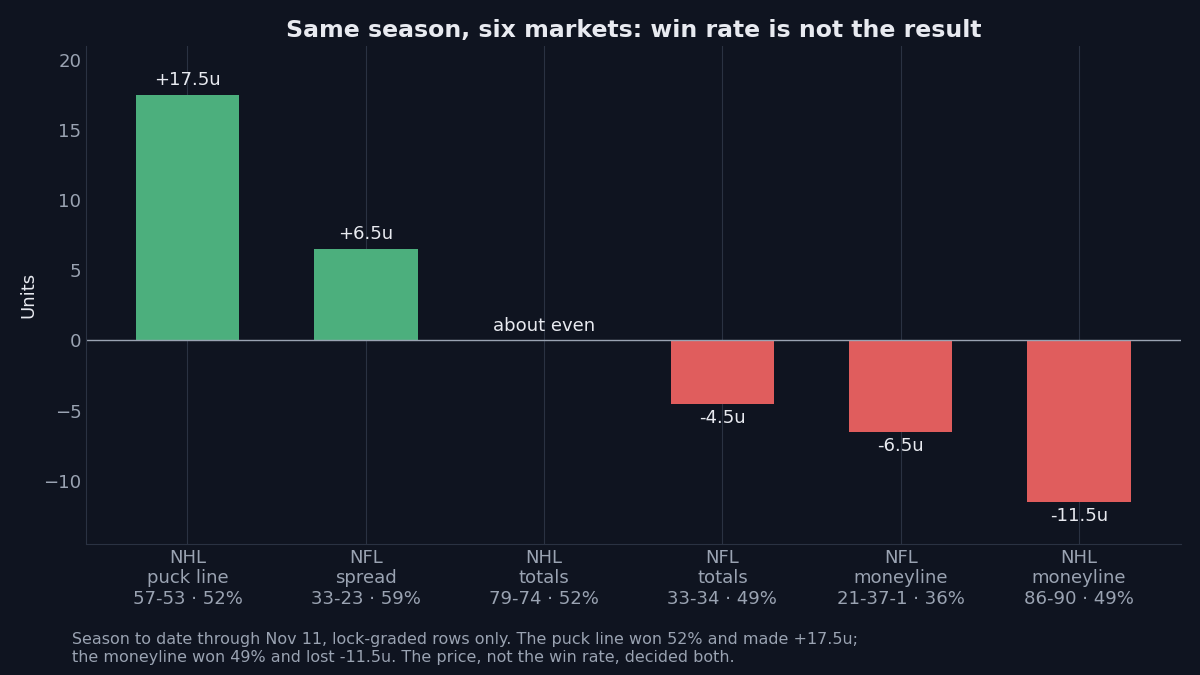
The season record shows what the hurdle does in practice. Through Nov 11, on lock-graded rows only: NFL spreads won 59% of their games and made +6.5u. NHL puck lines won 52% and made +17.5u. NHL totals won 52% and finished about even. NFL totals won 49% and lost -4.5u. NFL moneylines won 36% and lost -6.5u. NHL moneylines won 49% and lost -11.5u.
Look at the two 52% lines. The puck line and the totals won the same share of games, but the puck line's plus-money prices paid more than a unit per win, while the totals sat mostly at -110, where a win pays about a unit and a loss costs a full one. The moneyline shows the other side of the same coin: it won 49% in hockey, close to half, and still lost -11.5u, because most of its leans were favorites at minus prices, where every loss costs a full unit and every win pays back less. A record without its prices is half a record. Read the price first, and the wins and losses will make sense.
That is the whole trick. A price is a chance, the vig is the gap between the two sides and 100%, and the bar a price sets is the number the model has to beat. When you read a card this way, a lean stops looking like a prediction and starts looking like what it is: the model's chance next to the market's chance, with the vig already counted against it.
21+. If gambling stops being fun, call 1-800-GAMBLER.