Why this site publishes the tests that do not pass
Every card on this site comes from a model, and every model idea starts as a test: does this idea beat the market by enough to matter? The bar is written down before the test runs, and the result goes on the record either way. That is why you will find losing weeks and losing tiers on these pages right next to the winning ones. They are not oversights. They are the point.
A site that only shows the tests that pass is showing you a selection, not a record. A record that keeps its misses is the only kind you can learn from.
What a test has to clear
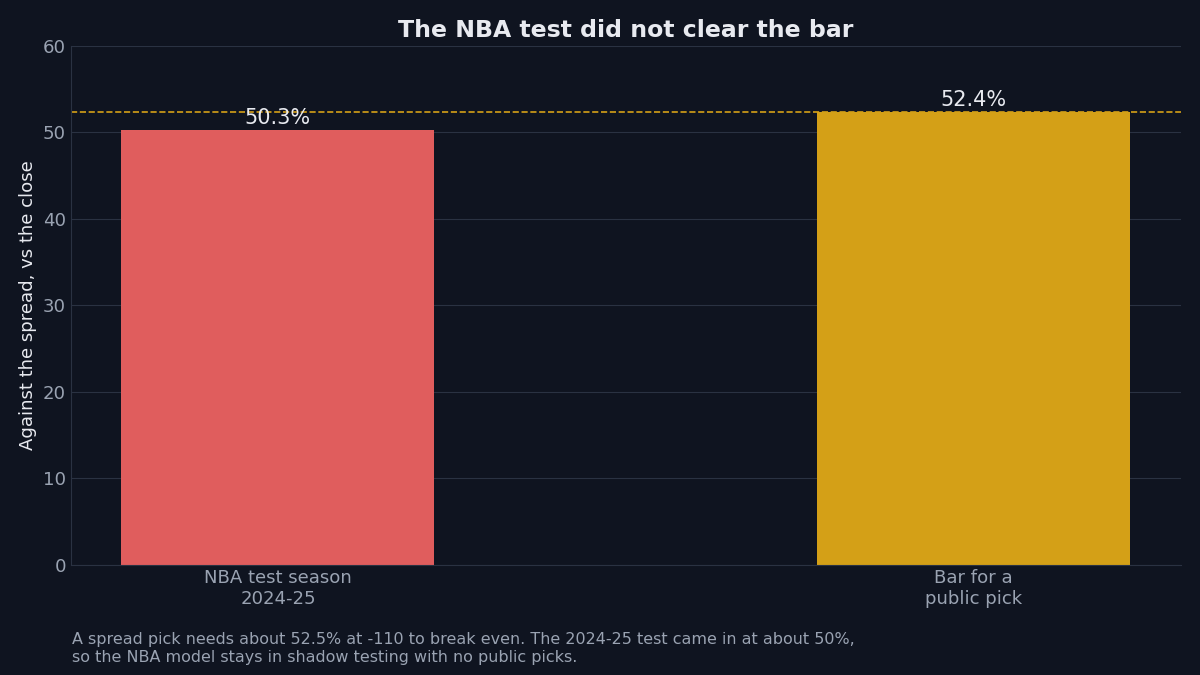
A test is a question with a number attached. For a spread idea, the bar is the break-even line. At a price of -110, a spread idea has to win about 52.5 in every 100 to break even, because the price charges for the privilege of the bet. Anything below that line loses over time, however good it looks on a short run. So the bar for a public pick is 52.5 in every 100 against the closing line, with the average miss inside a limit written down at the same time.
Two parts of that rule matter. The bar is set before the test runs, on a season the model has never seen. Setting it after seeing the result would let any idea pass by moving the line to where the result already landed. And the test is measured against the closing line, not an early number. The close is the market's best guess.
The NBA test that came up short
The clearest example on this site is the NBA model. On the 2024-25 test season, it covered about 50 in every 100 against the close, with an average miss of about 11 points. The bar for a public pick is 52.5 in every 100. The test came up short, so the NBA model stays in shadow testing, with no public picks, while the work on it continues.
That is the system working as designed. A model that covers half its spreads at -110 loses a little on every 100 picks, and publishing it as a public card would dress up a losing idea as a winning one. Keeping it in shadow costs the site a whole sport of content, and that is exactly the cost the bar is there to impose. A test that clears the bar earns public picks. One that does not earns more work, in shadow, until a new version is tested on a fresh season.
A losing tier on a live card
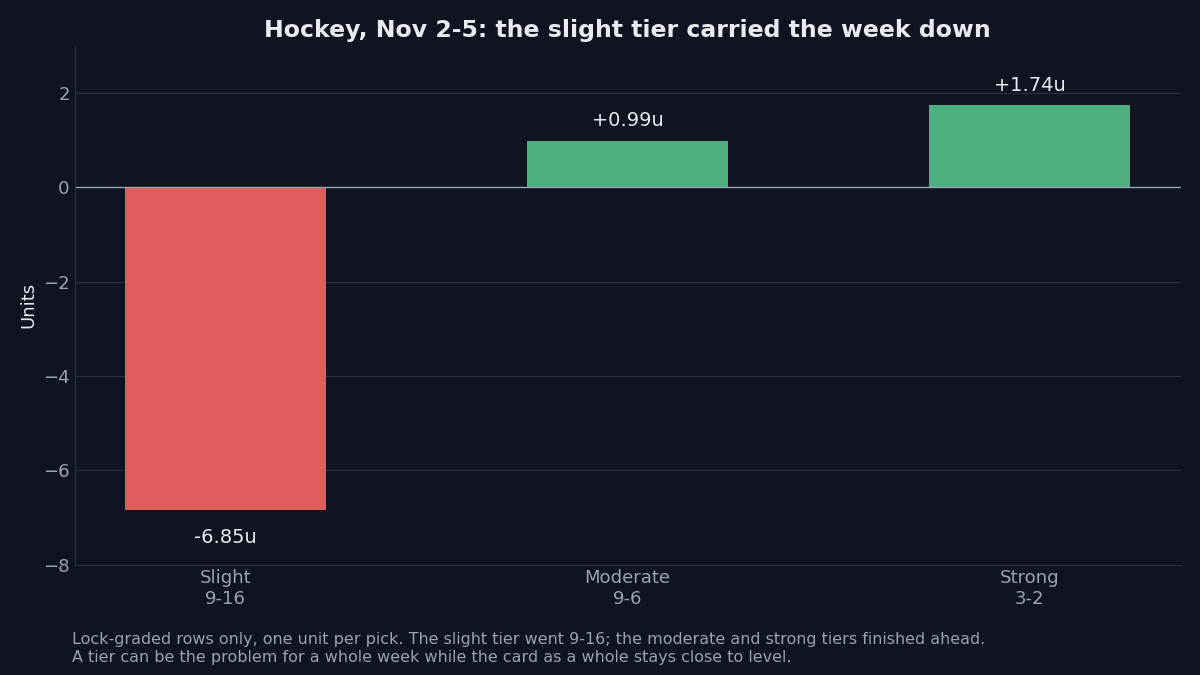
Tests do not only live in the lab. Every night on the public card is a small test of the same idea, and the tiers show it. The week of Nov 2 to Nov 5 in hockey is a good example. The slight tier went 9-16 for about -7u. The moderate tier went 9-6 for about +1u. The strong tier went 3-2 for about +1.5u. All three numbers are on the record.
Single nights are louder still. On Nov 5, the slight tier in hockey went 1-10 for about -8.5u. On Nov 1, all five strong calls in football lost, and the card finished 10-16 for about -7u. On Oct 30, the hockey card went 0-8 for -8u. The lock froze each line, and each result graded at that line.
Trend rows get the same treatment. A goalie-matchup band on a recent hockey card reads 12-18 for about -4.5u: games where the other side has an elite goalie in net. It stays visible so nobody builds on it.
Nine nights, all of them on the record
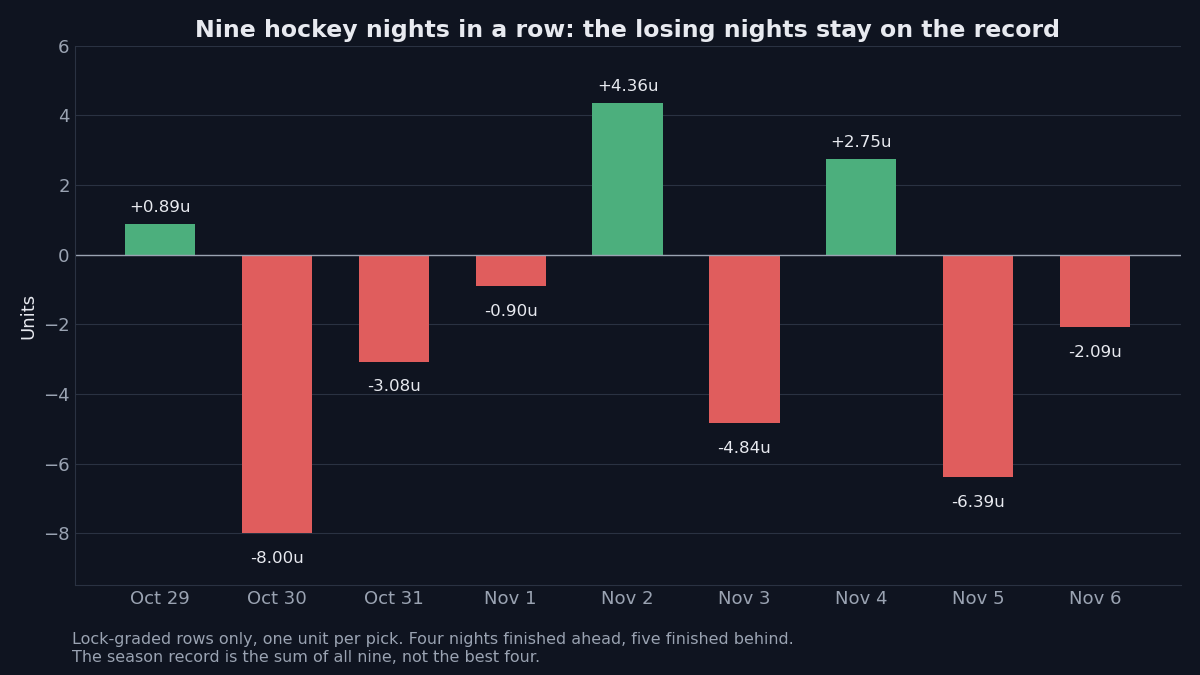
The nine hockey nights from Oct 29 to Nov 6 tell the story in one picture. The nights finished at about +1u, -8u, -3u, -1u, +4.5u, -5u, +3u, -6.5u, and -2u. Four nights finished ahead and five finished behind, for about -17.5u across the nine. The season record is the sum of all nine, not the best four.
Through Nov 6, the hockey season stands at 198-202 for about -3.5u, and the football season at 77-82-1 for about -1u. Both sit just behind level, and both numbers include every losing night in the run. That is what makes them useful. A record that only counted the good nights would show a winning card that never existed.
How to read a test that comes up short
Three checks, in order. First, sample size. One night is noise; a full season is a test. A tier that goes 1-10 on one night has had a bad night. A model that covers about 50 in every 100 across a whole season has had a real result.
Second, the bar. Did the idea miss by a point or by a mile? The NBA test missed by about 2.5 points in every 100, a clear miss, not a near miss. A near miss argues for a small change and a retest. A clear miss argues for a rethink.
Third, what changed after. Did the idea change, or did the bar move? A test only means something if the bar stays where it was written. A new version of an idea gets a fresh season and the same bar, not a lower one.
The short answer is that the record is the product. Picks are the content, but the record is the reason to believe any of it. Every number here is graded at a locked line, counted in units, and kept on the books when it loses. If the misses were hidden, the wins would mean nothing. The next test that comes up short will be on this record too.
21+. If gambling stops being fun, call or text 1-800-GAMBLER.